
I put together some more images, with fresh data, to help those who still can't see the U-shaped crash and recovery pattern. It's a pattern that has repeated NONSTOP on the logarithmic chart since the very start (2009).
Right click and 'view image' for full screen:
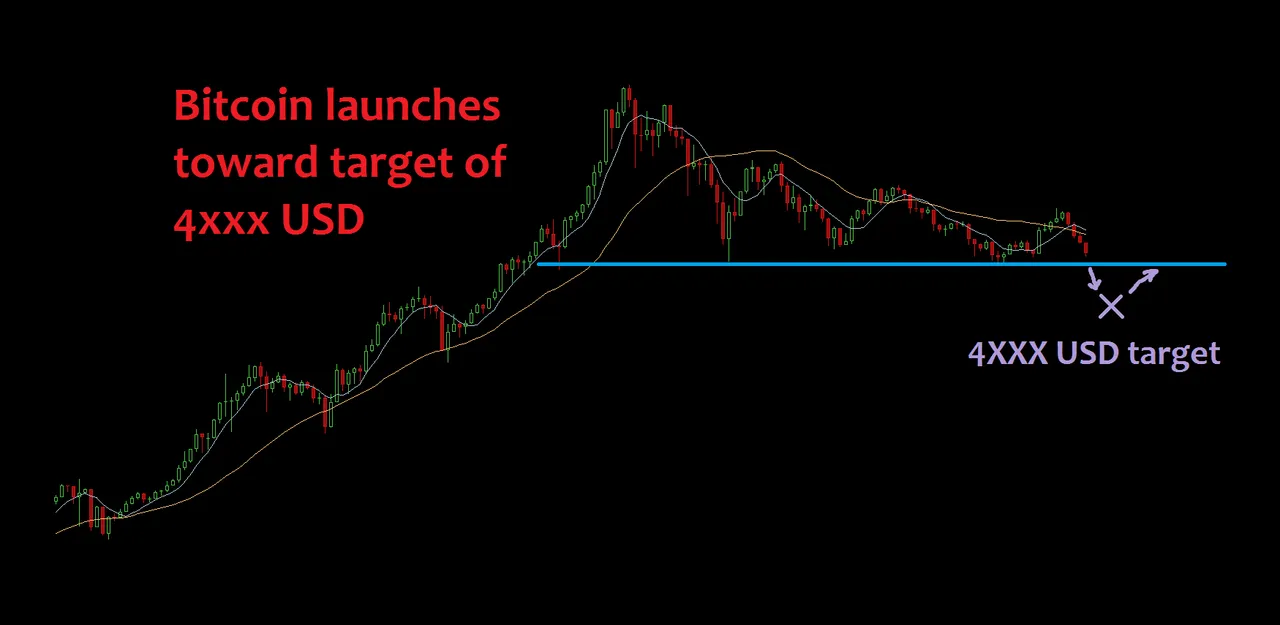
Above, we see the support level just under 6000 USD. A lot of downward pressure and momentum has built up. Will the 6000 level be able to halt this crash?
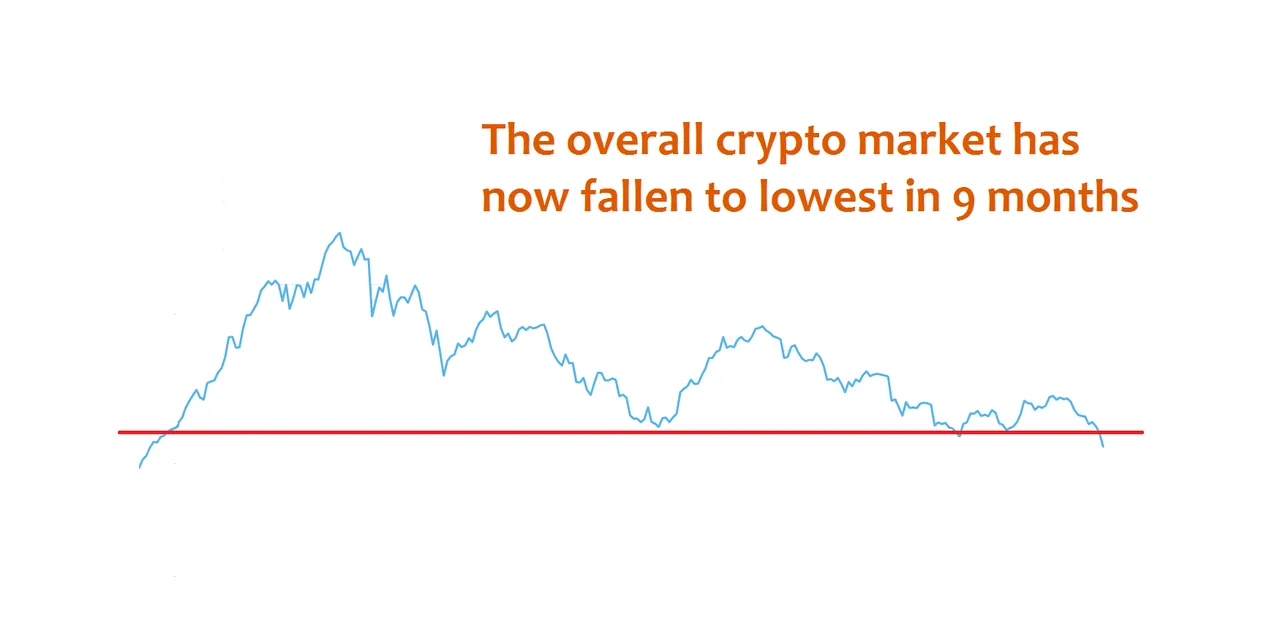
The above chart shows the "cryptocap" or total cryptocurrency market capitalization. Also known as, the total dollar value of every cryptocurrency on the planet. The corresponding level on this chart has already been broken, quite brutally. This tells us the 6000 level on the bitcoin chart is probably doomed.
Now, check out the similarities with the previous crash in 2014:
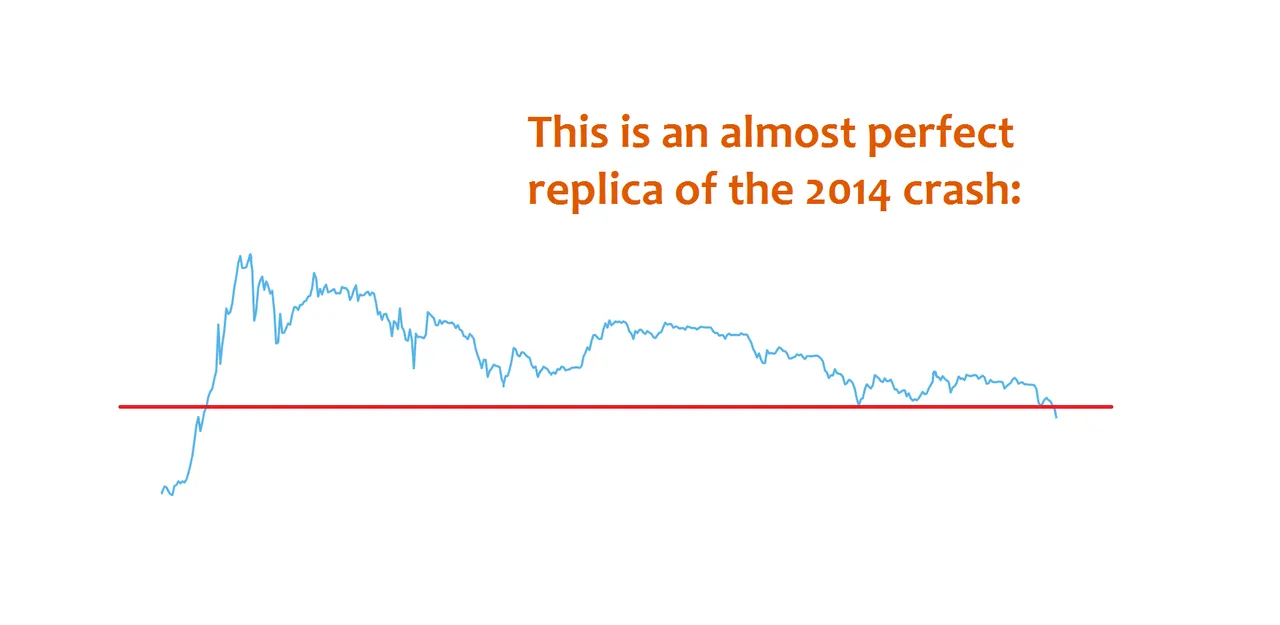
I've been posting about these similarities since I spotted the pattern several months ago. I'm shocked that to this date, I can't find anyone else talking about this. It's clear as day!
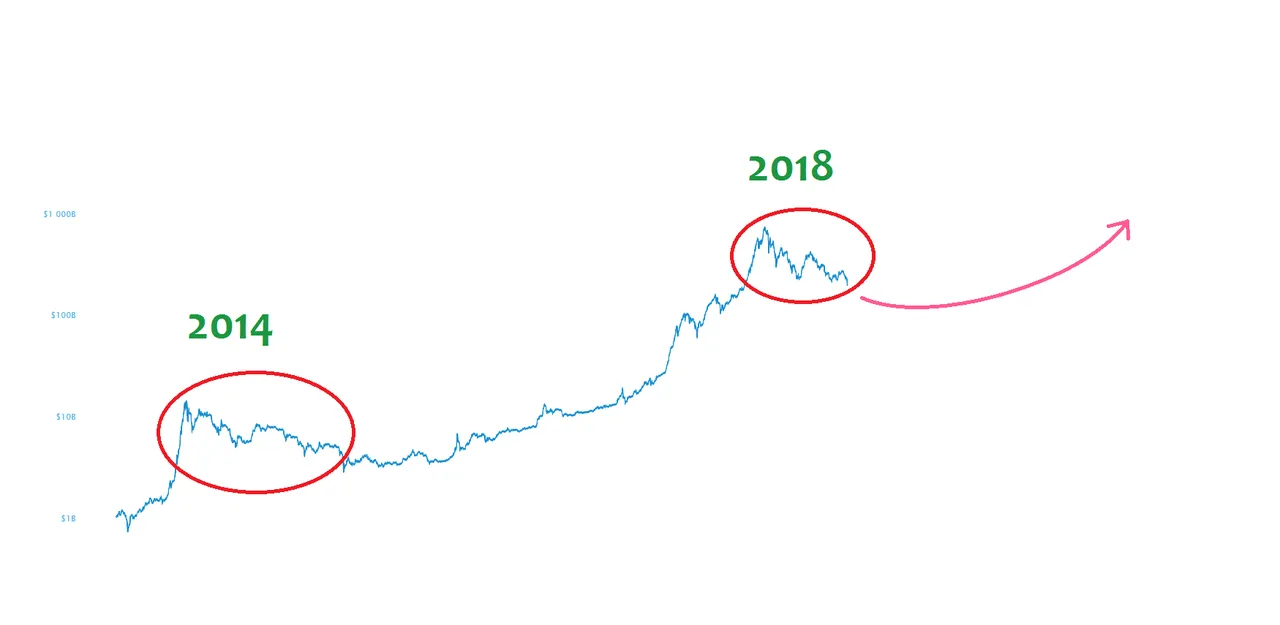
Unless there's an "end to the trend" right away, perhaps for a fundamental reason like a legal decision or a software fork, Bitcoin should bottom after one more nasty smashdown, then recover through 2019 to new highs in 2020.
Nothing is guaranteed, but anyone trading this pattern since I first posted about it is floating in gains right now.
This isn't advice, but it's something worth looking into. I don't trade, on principle, and I don't own any Bitcoin. I have a few hundred dollars worth of Steem, and that's it for my crypto "holdings". I prefer to earn and save, but to each their own.
DRutter