
A few months ago, in this post, I said:
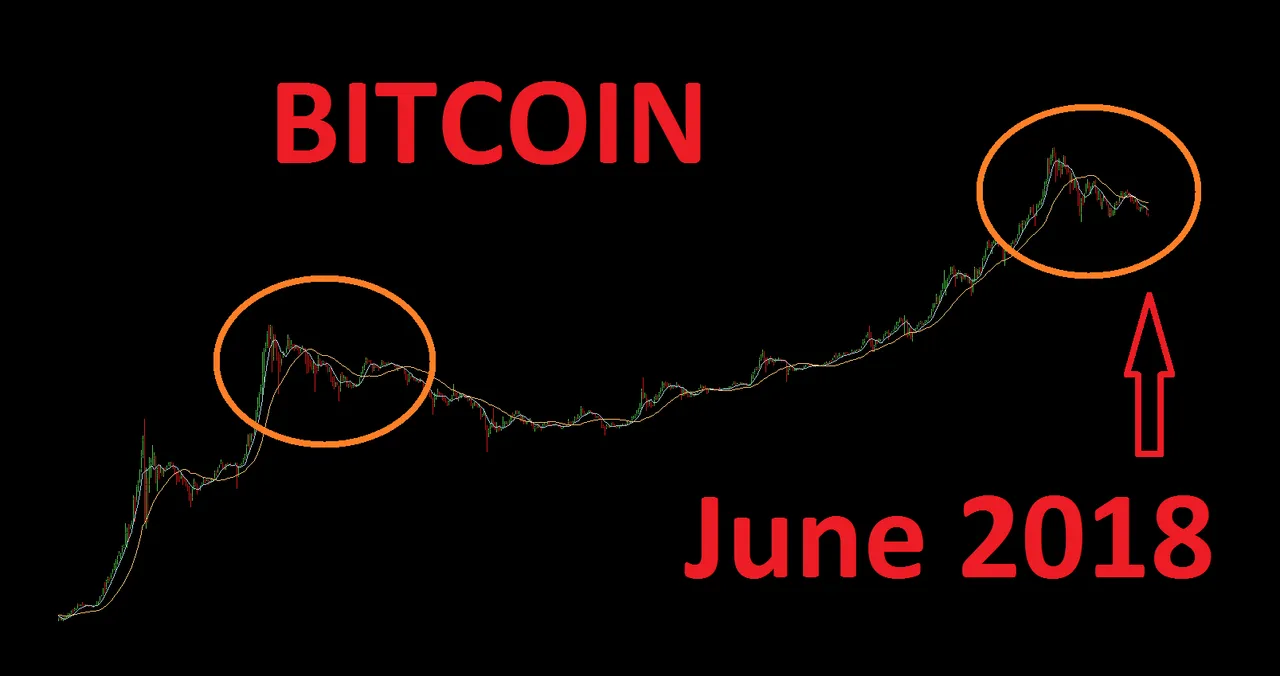
"The current chart (at the orange arrow) looks reminiscent of the 2014 correction which lasted over 2 years:
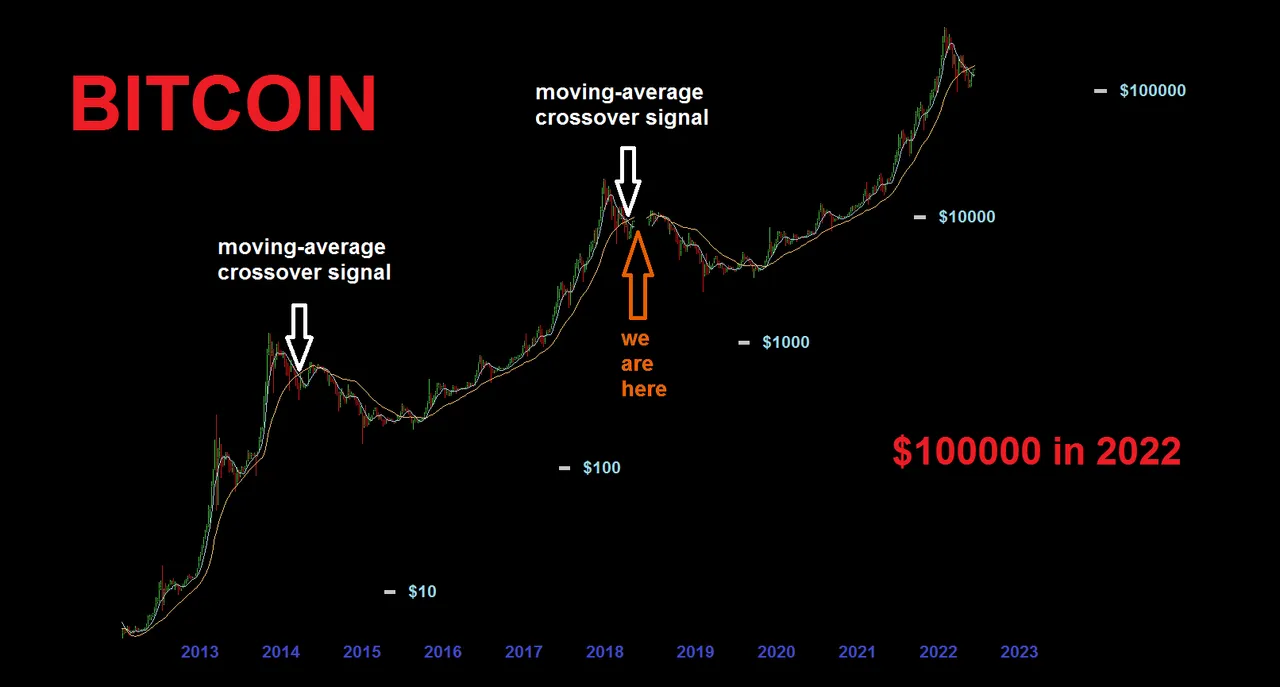
The 2014 moving-average crossover signal has recurred, making a longer correction seem likely, and would place the next leg up around 2022."
"Longer correction" now confirmed by chart
As our confidence in this predicted pattern grows, we can use it to predict the bottom (in terms of dollars, and in terms of time), and when the next move up might be.
- market collapse isn't over yet
- bitcoin to fall to 4000 or lower and stay there all 2018
- 2019 will be the recovery year
- 2020 will bring new highs
- market will peak at about $100000 in 2021
Obviously, these are only educated guesses about what MAY happen.
I think STEEM will continue to move along with the overall cryptocurrency markets. The next year or so might be a buying (or earning) opportunity, followed by a couple very exciting years of big gains.
As I've noted for many years now, the Bitcoin chart sticks to patterns and follows classic technical analysis far better than typical charts like stocks and commodities. There's no guarantee that a pattern will continue, but it tends to continue more often than not. Spotting and analyzing patterns like this one may be useful.