

SUMMARY
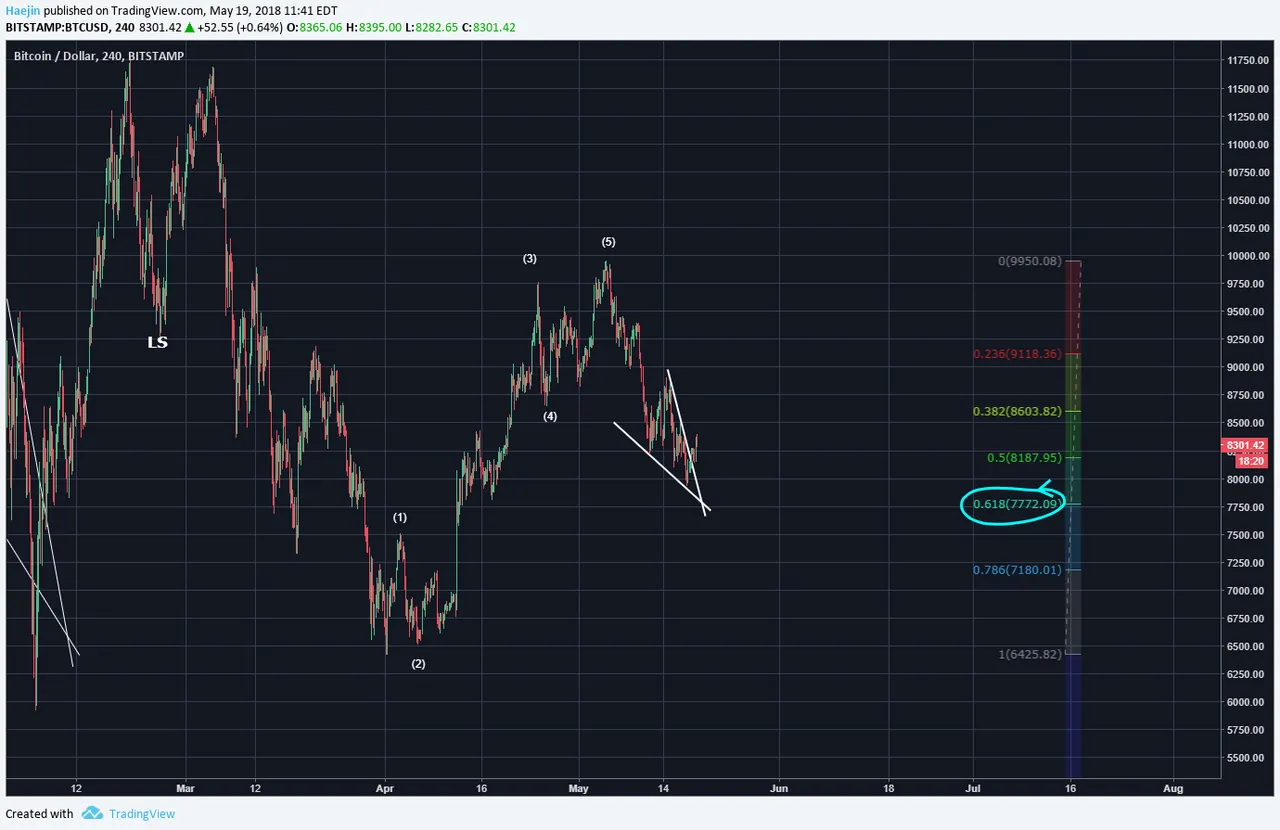
Overnight, Bitcoin (BTC) seems to have broken out of the smaller downward wedge pattern that was discussed yesterday. However, price has not reached the 0.618 Fib level (blue circle). It's a bit unusual for the correction to end like this, so likely, a lower low is still to be expected. The video has more details.
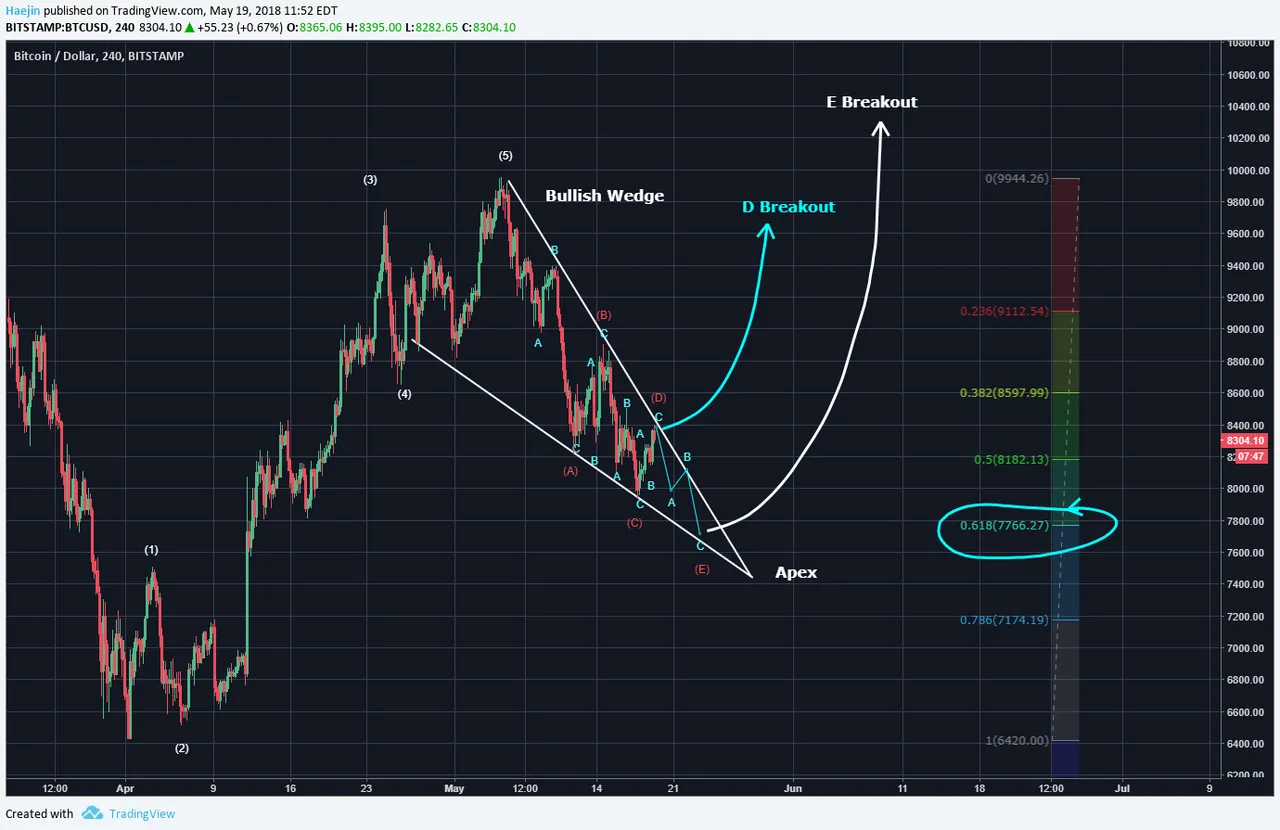
I've now expanded the bullish downward wedge to the whole correction. You can now see how the smaller wedge as shown in the first chart fits into this larger one. The red ABCDE waves have been labeled and E is still calling for the mid $7,600 or so. While still keeping into awareness that there can always be a D wave breakout, it would be too far away from the apex and unlikely to provide a sustainable rally. The E wave breakout would be most ideal.
Legal Disclaimer: I am not a financial advisor nor is any content in this article presented as financial advice. The information provided in this blog post and any other posts that I make and any accompanying material is for informational purposes only. It should not be considered financial or investment advice of any kind. One should consult with a financial or investment professional to determine what may be best for your individual needs. Plain English: This is only my opinion, make of it what you wish. What does this mean? It means it's not advice nor recommendation to either buy or sell anything! It's only meant for use as informative or entertainment purposes.
Please consider reviewing these Tutorials on:
Elliott Wave Counting Tutorial #1
Elliott Wave Counting Tutorial #2
Elliott Wave Counting Tutorial #3
Laddering and Buy/Sell Setups.
Laddering Example with EOS
Tutorial on the use of Fibonacci & Elliott Waves
@haejin's Trading Nuggets
Essay: Is Technical Analysis a Quantum Event?
Follow me on Twitter for Real Time Alerts!!
Follow me on StockTwits for UpDates!!
--
--

