Time: 8.32 A.M. / GM+2 / 29th May 2018 – Tues.
We wrote in our last update:
"A clear break below the crucial support 7.100K - 7.210K area ( Daily Close ) will move the price below 5.947K towards the next major support level at 5.878K."
But due to, the tight move of bitcoin price around this level, our Worst Expectations are coming to reality right now as most likely the downward move will continue, supported by 2 weekly ( G seen on chart ) bearish stop grabbers.
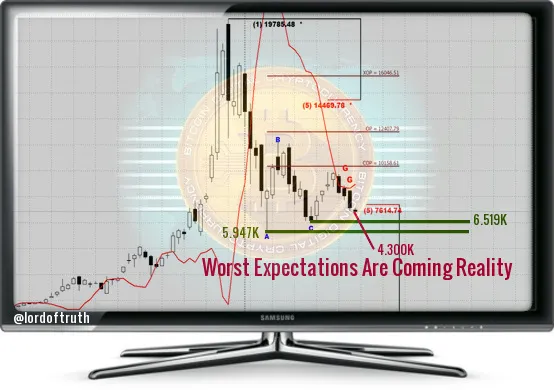
- At press time, bitcoin is trading around 7.100K and the chances will be valid to achieve more decline to extend losses to reach 6.519K - 5.878K - 4.300K.
In our previous post / 606 / we had forecast the trading range will be between 7.210K and 8.175K. The intraday high was 7.378K and the low was 7.040K.
Bitcoin is at a Critical Junction after breaking 10 month trend line support around 7.614K and we doubt the crucial support 7.100K - 7.210K area will hold.
MACD is moving in the bearish zone and RSI ( 4H ) is currently just below the 40 level.
Looking at the weekly chart, will see that bitcoin price has failed to reach 10.158K and turned down, and the 2 weekly bearish stop grabbers after breaking 7.614K, suggest drop below 6.519K, to test 5.878K reaching 4.300 area, where a Potential Bullish Reversal can take place.
We will suggest / Bearish Trend / for today.
Support 1: 6519.000 level.
Resistance1 : 7614.00 level.
Support 2: 5878.000 level.
Resistance2 : 7800.000 level.
Expected trading for today:
is between 6915.00 and 7614.00.
Expected trend for today :
Bearish.
Medium Term:
Neutral.
Long Term:
Bullish.
The low of 2018:
5947.00 !!! / 4300.00 Expected.
The high of 2018 (BitcoinTrader's Year):
14469.00 / Expected.
The low of 2019: ???
The high of 2019 (Bitcoin Holder's Year):
36000.00 level / Expected.

investing considerable time and effort up front in
hopes of considerable returns down the road.
I'm so proud of my little blog, and so grateful to all of you
for support to keep it going.