Time: 10.51 A.M. / GM+2 / 23th July 2018 – Mon.
In our previous post / 660 / we had forecast the trading range will be between 7.000K & 7.650K. The intraday low was 7.333K and the high was 7.650K.
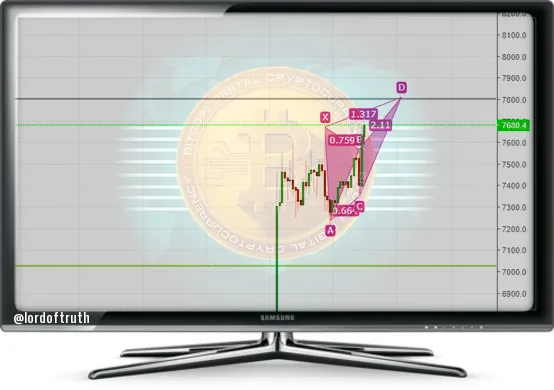
Bitcoin price today started with clear positivity to surpass 7.600K,
and most likely the bullish move, supported by stochastic positivity,
will continue to push the price towards 7.800K area, and this upmove will be followed by a decline to 7.000K, as 4H Chart shows that,
Bitcoin price prepare to a retracement by Butterfly "Sell" Pattern towards 7.000K - 7.050K area.
Sentiment
The trend is Neutral for today.
Support 1: 7050.000 level.
Resistance1 : 7800.00 level.
Support 2: 6842.000 level.
Resistance2 : 8250.000 level.
Expected trading for today:
is between 7050.00 and 7800.00.
Expected trend for today :
Neutral.
Medium Term:
Bearish.
Long Term:
Bullish.
The low of 2018:
4267.00 / Expected.
The high of 2018 (BitcoinTrader's Year):
14469.00 / Expected.
The low of 2019: ???
The high of 2019 (Bitcoin Holder's Year):
36000.00 level / Expected.

investing considerable time and effort up front in
hopes of considerable returns down the road.
I'm so proud of my little blog, and so grateful to all of you
for support to keep it going.