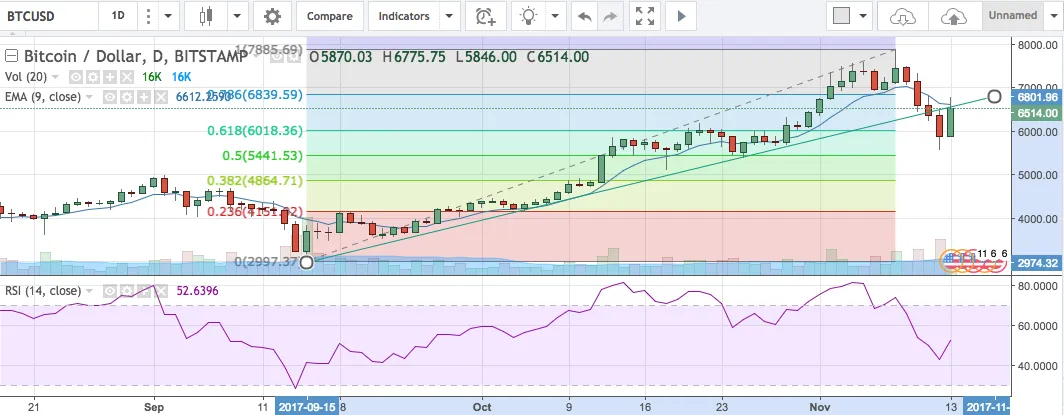
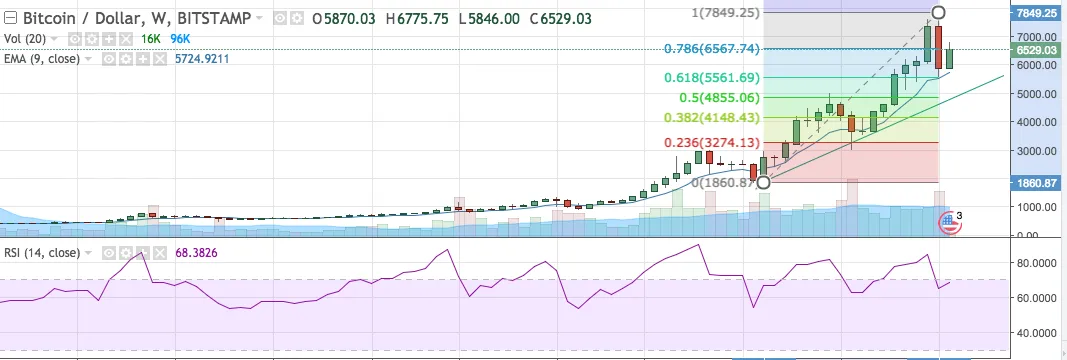
Below is the daily chart for BTC/USD we can see that the $6000 level seems to be showing some support though we are at resistance as we try to break through the trend-line once again to find a more solid support, during the sell-off we have moved away from overbought territory as indicated by the RSI. The fibonacci retracement shows the sell-off has reached the 60% range which is a healthy pullback though it does not mean it is over.