
Overview of Bull Run
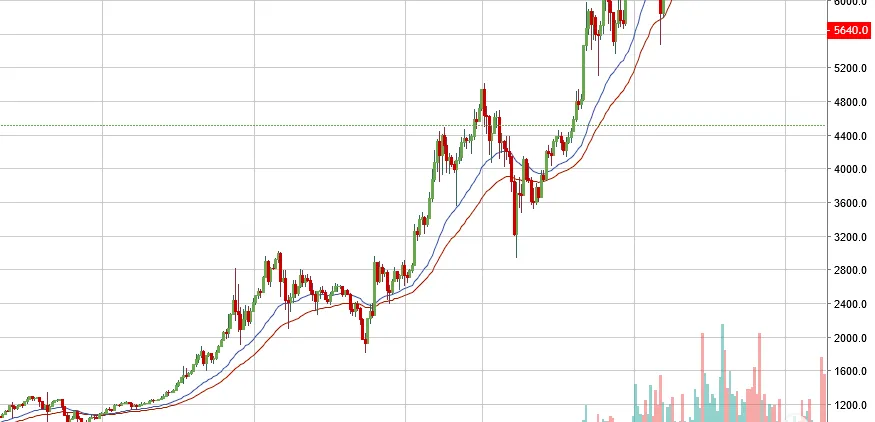
A quick look to the daily charts in 2017 will show you the start of the bull run from near $1000 to $3000. This was the move that cemented the mainstream media Bitcoin coverage and drew an absolute colossal amount of investors. In fact, most investors first saw/considered Bitcoin during this time period.
It shows exuberance till $3000, then a correction followed by what can only be called absolutely irrational pumping. Bitcoin saw some resistance at $5000, after which it simply floated its way up to $10000 with little to no corrective action. The trend with Bitcoin is that major resistances have been tested as supports. This means we are most likely to the point of resistance from the start of the bull run where the exuberance started. This point happens to be between $2900 and $3100 (depending on which exchange you see).
Current Scenario - Possibilities
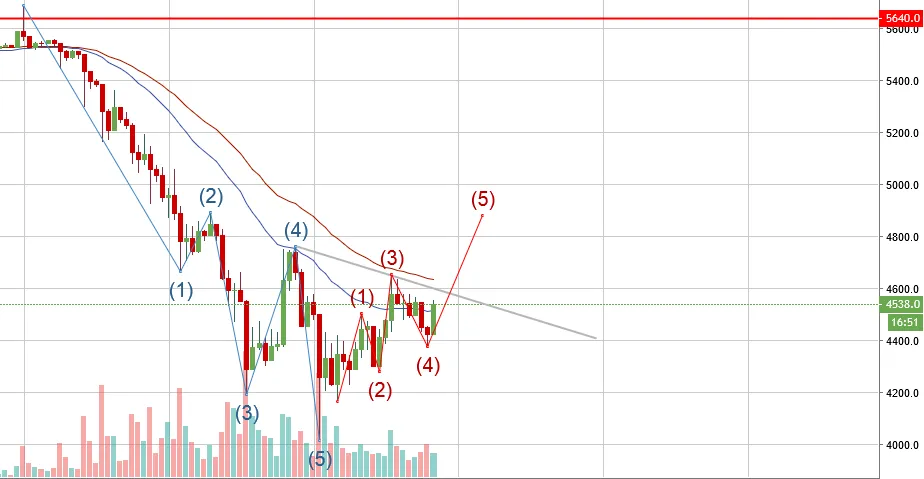
Right now, Bitcoin is looking very conflicted on the hourly candles. There seems to be a possibility for two scenarios to play out in the short term. In the last few days, this is one of the few opportunities the bulls have to cement a short term uptrend. After a 5 wave move played out, it is possible that it was the end of a 3-5-5 move and that start of a bullish leg. In order to get a 100% confirmation of this, the hourly candle must break out above the trend line and close above the top moving average. This will possibly be the last bullish leg we see for a week or so. It might be necessary in fact for this bullish leg to come through so that upside liquidity can be absorbed for the sells to truly overpower buys like it did at the $6000 and $5000 psychological levels.
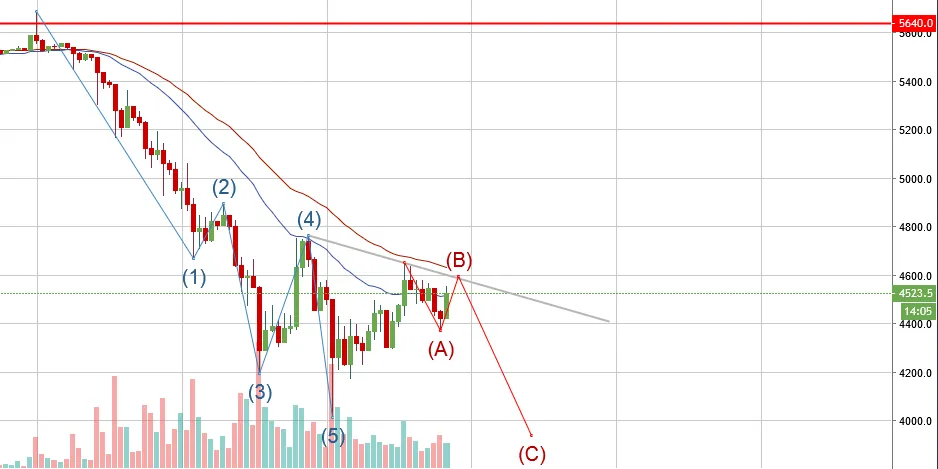
The most likely scenario based on second order thinking would be for Bitcoin to touch the trend line and post it's resistance at the spot, further confirming the series of lower highs (LH) and lower lows (LL). This would mean that Bitcoin going on it's corrective C on a 3 wave move will go below $4372 and most definitely break the $4010 support and the $4000 psychological level. The bear case here seems more likely to happen. Longs need not worry as this is not going to persist for a very long time, once we hit our $2900-$3100 level as anticipated now, Bitcoin will post an incredibly bullish candle that cannot be missed. I wouldn't be surprised if we break $10k in January upon the launch of Bakkt, given all the hype and the co-relation between technical analysis and influential news.
- AB
Previous posts:
- Bitcoin Technicals: In Depth Breakdown of the Current Move
- The Scalability Trilemma
- Online Retailer’s Incentives for using cryptocurrencies as a medium of exchange
Crypto Analysis Series
- Part 1 - Basic Attention Token and How It's Revolutionizing the Internet
- Part 2 - Golem Network Token as a Potential Giant Killer
About Reverse Acid
![]()
Be a part of our Discord community to engage in related topic conversation .