
View my post again and see the chart I added. Also click the link I provided to Martin Armstrong’s blog. As you can clearly see, Bitcoin is one of the few assets in the world which broke out over the downtrend line after July 12 along with the US and Canadian dollars (and their stock markets). The rest of the world, gold, and silver didn’t have this breakout.
Note that July 12 was a turning point on Armstrong’s ECM model. Read his blog post and correlate it to my chart of BTC above.
BTC looks to be a buy now, unless somehow this breakout was a bull trap. I did predict the recent move to $8000+ be a bull trap. Also I called the triple bottom at $6000. All those predictions were in my bitcointalk.org posts under the username @anunymint. All the posts were nuked.
BTC has very likely bottomed at $5850 and are going to moon again during the year of the next mining minted block reward halving which is 2020. The halving will be at the end of Q1 2020 (earlier than past halvings) so we should start to break out above the last ATH no later then Q2 2020. We can see the U bottom forming as it is did in 2014 and 2015.
IOW, as Armstrong’s thesis short-dollar vortex peaks going into 2020, that is when capital will shift out of the USD dollar bubble and into Bitcoin sending BTC to a nosebleed, moon ATH in 2021. All the world’s capital has to stampede first into the USD by 2020 and once it is caught up there, it needs a new place to go as that peaks. Bitcoin and other tangible assets will be the only thing remaining as capital needs to get off-the-grid of the clusterfucked financial system.
Armstrong needs to pay attention. Bitcoin is clearly the alternative reserve asset to the US Dollar. It is growing while the USD will peak coming 2020 or so. By middle of next decade Bitcoin will be over $5 trillion market capitalization. Gold and silver are not responding as alternatives. They are highly impractical now because you can’t travel with them.
The following charts scares everyone into thinking we may go much lower:
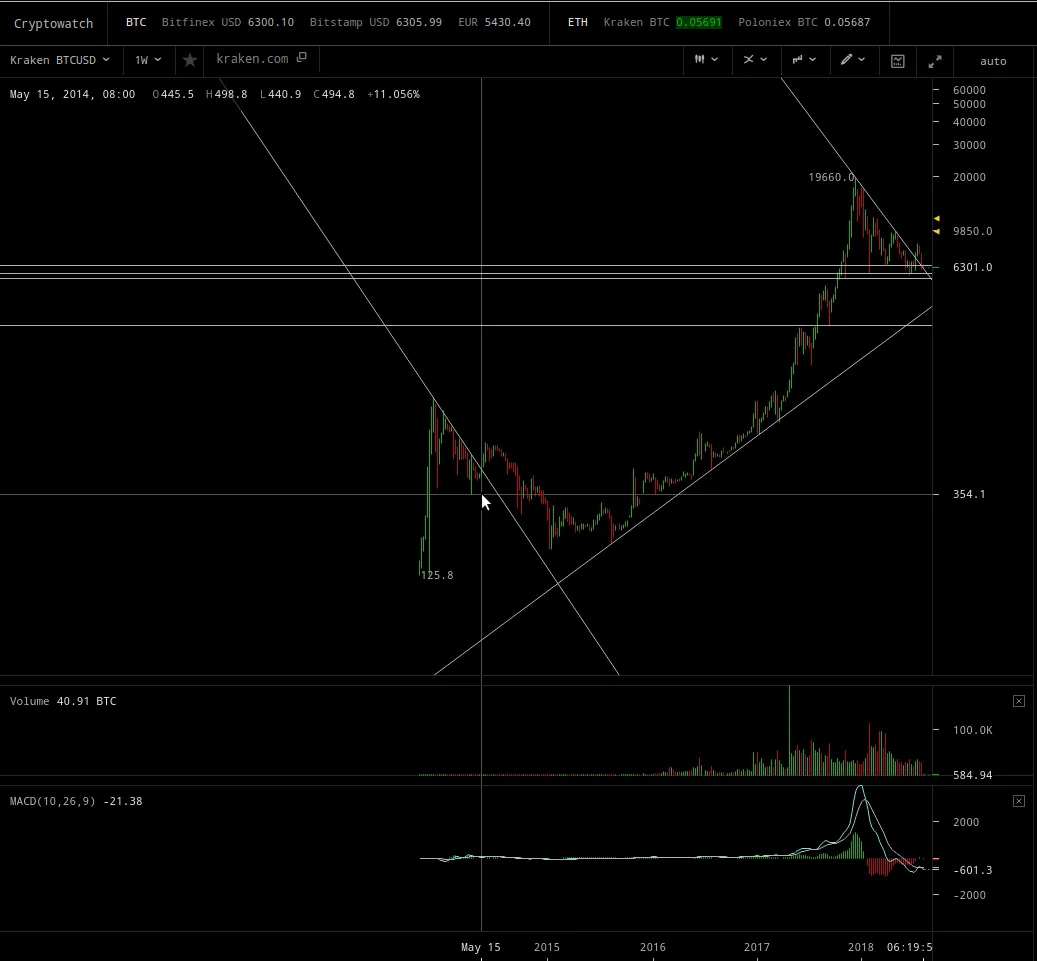
(click to zoom)
But notice the breakout above downtrend line in 2014 did not immediately come back down to test the breakout downtrend line as support. And notice how just before the breakout in 2014, BTC made a lower low.
Whereas in 2018, we had a triple bottom at $6000ish and the breakout did come back down to test the downtrend line. This appears to be forming a much shorter duration cup than 2014 – 15.
Also note that the prior halving was July/August 2016 and BTC bottomed in January 2015, so 16 months prior. The coming halving will be end of Q1 2020, so we should bottom in September 2018. We could possibly bull trap bounce again and come back down to test $6000ish again by Q4 2018. IOW, the U bottom must be much more compressed because the next halving is sooner.
RE: Bitcoin rises because land is becoming worthless