

SUMMARY
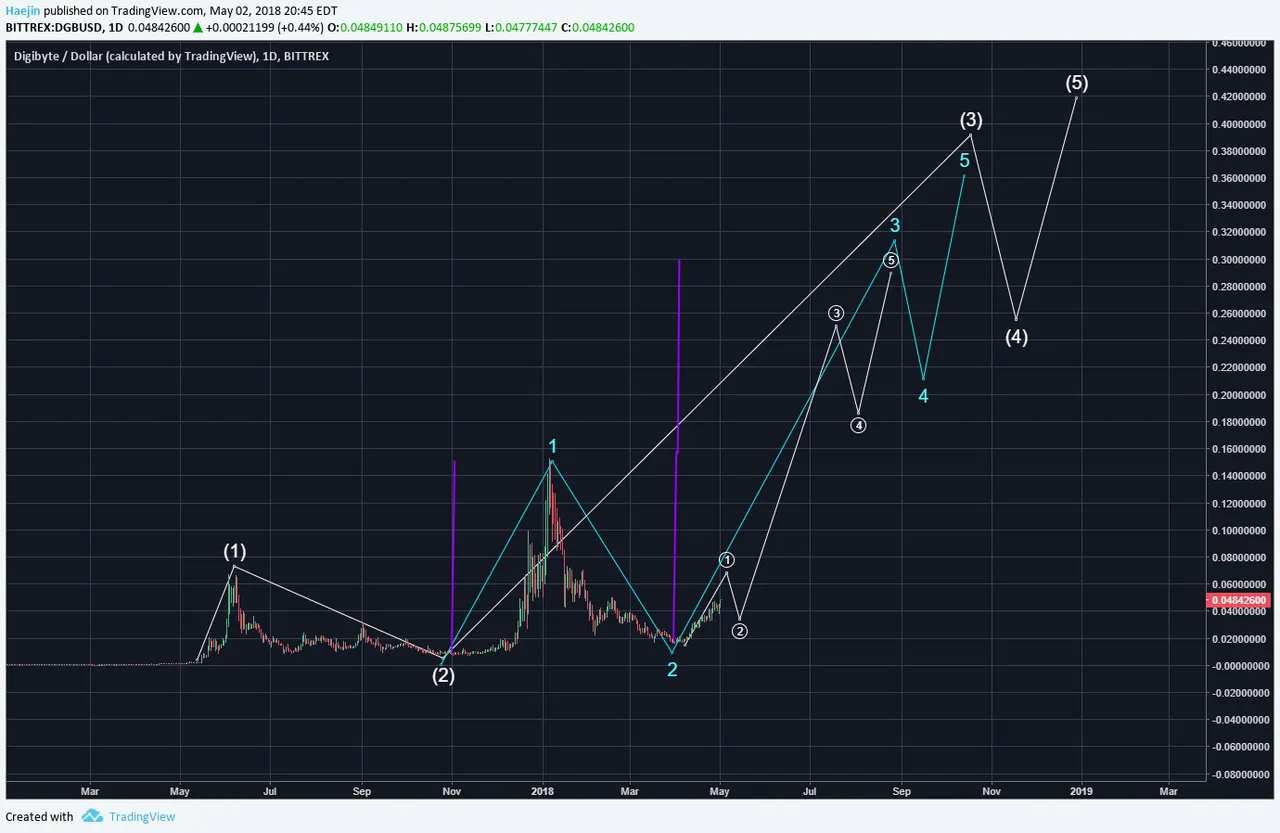
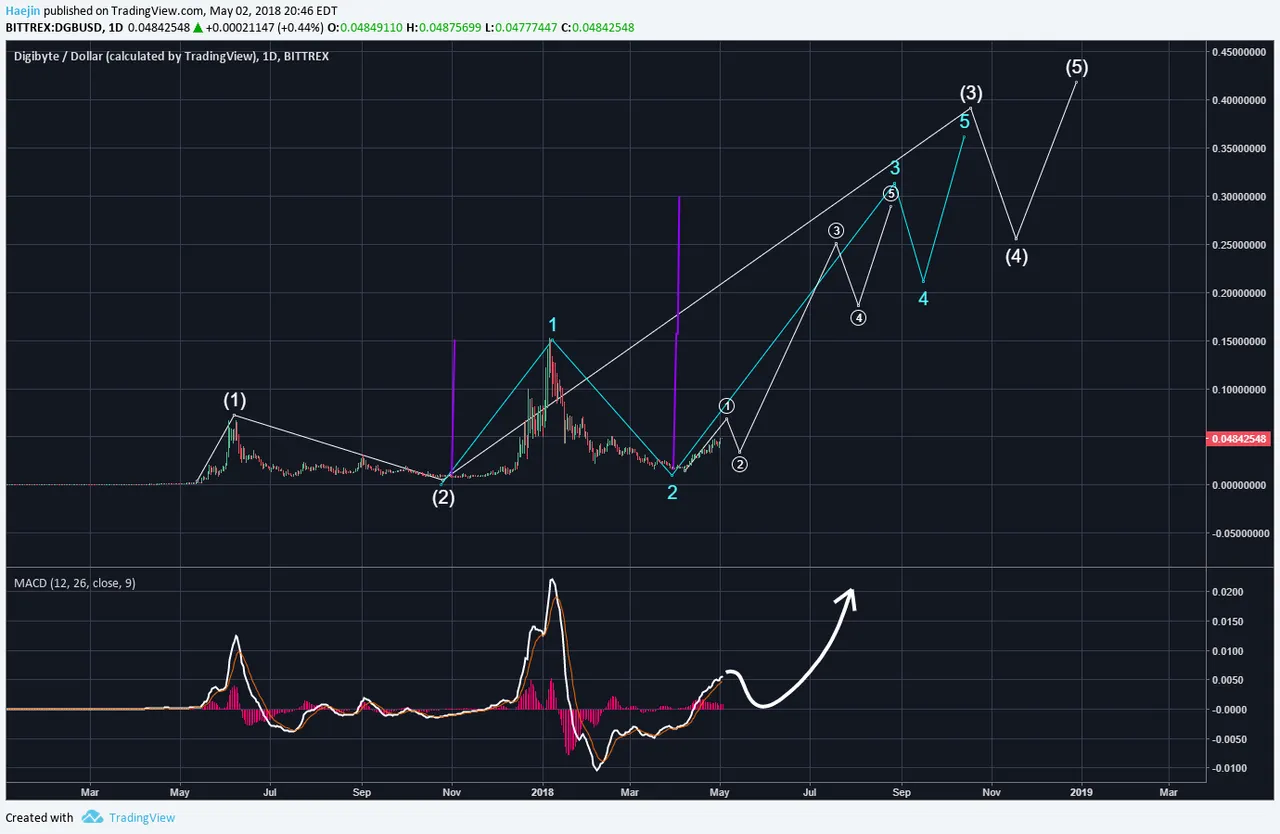
My long term projection for DigiByte (DGB/USD) has not changed. The below chart contains much of hte original markings that were presented back in February 16 post. The Elliott Waves labels have all been shifted to the right since time has passed. I believe DGB has much higher prices ahead and currently it's working on wave 1 of the first five impulse.
The MACD should also turn up after a small dip for wave 2. It depends on the degree of retracement for wave 2 but it'll likely be 0.618 Fib zone which means a bit of a deep correction is possible.
On March 12, the below chart was posted for DGB. This fractal of two rounded price formations still stand as valid. Price has simply progressed to start building the right side wall of the second fractal (blue).

Legal Disclaimer: I am not a financial advisor nor is any content in this article presented as financial advice. The information provided in this blog post and any other posts that I make and any accompanying material is for informational purposes only. It should not be considered financial or investment advice of any kind. One should consult with a financial or investment professional to determine what may be best for your individual needs. Plain English: This is only my opinion, make of it what you wish. What does this mean? It means it's not advice nor recommendation to either buy or sell anything! It's only meant for use as informative or entertainment purposes.
Please consider reviewing these Tutorials on:
Elliott Wave Counting Tutorial #1
Elliott Wave Counting Tutorial #2
Elliott Wave Counting Tutorial #3
Laddering and Buy/Sell Setups.
Laddering Example with EOS
Tutorial on the use of Fibonacci & Elliott Waves
@haejin's Trading Nuggets
Essay: Is Technical Analysis a Quantum Event?
Follow me on Twitter for Real Time Alerts!!
Follow me on StockTwits for UpDates!!
--
--

