Hi Steemians,
Welcome to Part 2 of my series on ‘Horse Racing – The support of addiction and cruelty’. Part 1 focused on the gambling aspect of horse racing and the profits made by bookmakers as well as some of the other costs of horse racing events. The link to Part 1 is as follows: @spectrumecons/horse-racing-supporting-addiction-and-cruelty-part-1.
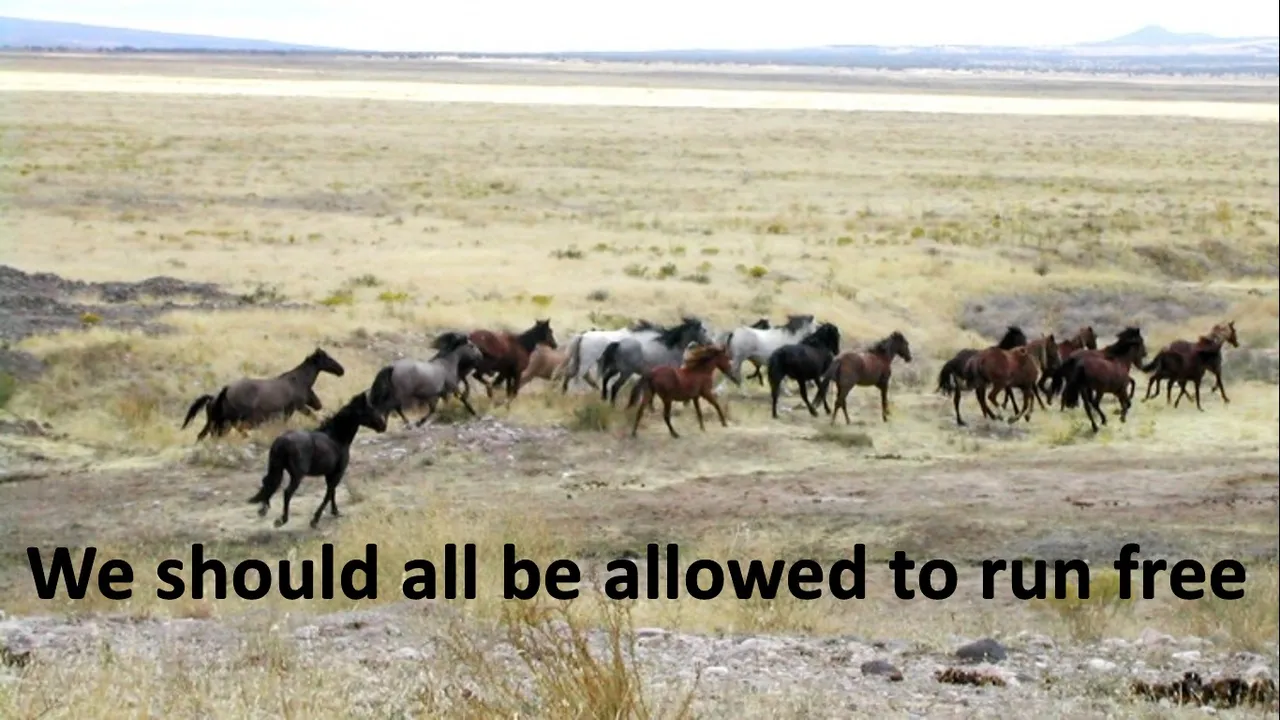
Part 2 of the series will focus on the animal cruelty side of horse racing events. Animal cruelty and abuse is rampant in the horse racing industry. According to horseracingkills.org, the average life of a race horse is 5 years. In the wild, the average lifespan of a horse is predicted to be 25 years. Race horses only live 1/5 as long as they would if they were wild. According to the coalition for protection of racehorses, one horse dies less than every 3 days in Australia. This very short existence is not a very pleasant one either.
Here are some videos by People for the Ethical treatment of Animals (PETA) explaining what happens to horses in the horse racing industry. The first video is a quick 60 second video of footage of abuse of horses at events. This abuse includes:
- horses being forced to race
- horses being pumped with drugs
- horrendous accidents and injuries that occur on the track
- what happens to horses that are not or no longer successful
Watch the video in the link below.
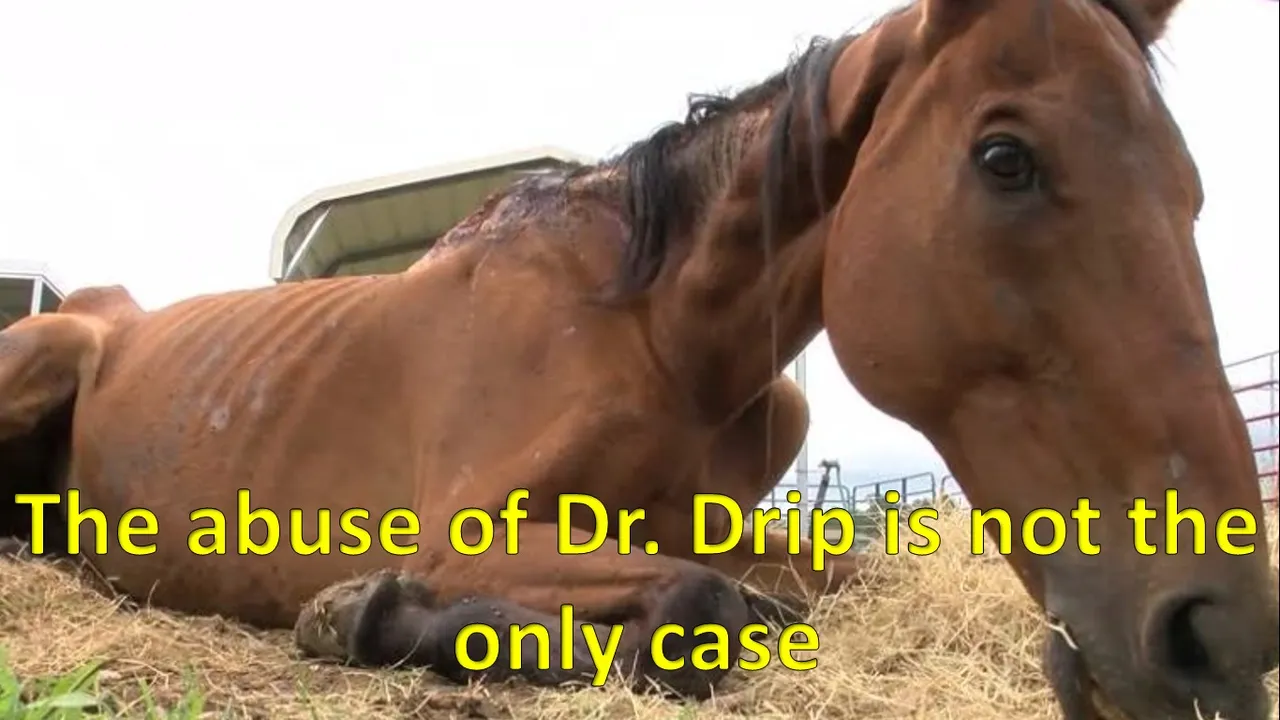
This second video takes a look at an investigation by PETA of leading thoroughbred trainer Steve Asmussen. This video reveals excessive mistreatment of horses. These horses are given dangerous drugs. They are forced to train through serious injuries. Jockeys use electric shock devices to try and get their horse to go faster. Watch the video in the link below.

There are many other videos and articles that you can find online that demonstrate the very cruel nature of the horse racing industry.
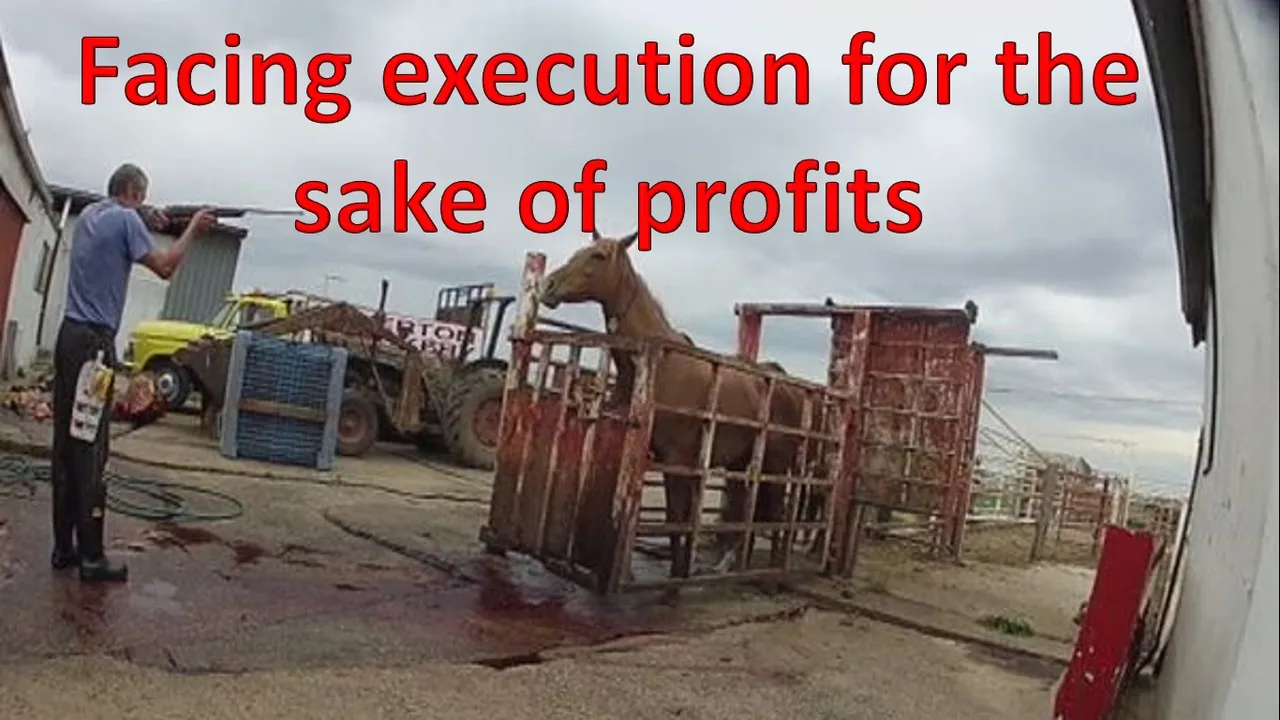
As you can see from the videos, horse racing is not kind to the horses participating. Horse racing is just as bad if not worse for horses that don’t get to the race. Thousands of potential race horses get sent to knackeries or slaughterhouses each year. Here is a video by the coalition for protection of racehorses. This video looks at what happens to race horses that do not make it to the track to compete.
These videos demonstrate what happens to horses that race and to horses that do not get to the races. Can we establish this as a cost of the horse racing industry? I have done some work relating to the statistical cost of life of different species of animals. I explain in the video below how I calculated the cost of a Big Mac using the statistical cost of the life of a cow as well as some numbers that I obtained from Meatonomics.
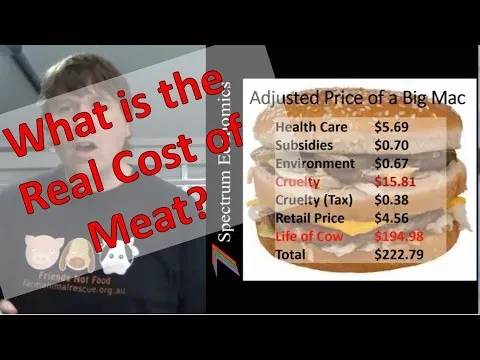
I can use a similar approach to calculate the cost of cruelty and loss of life of a horse.
Theory behind calculating value of statistical life for an animal
The value of statistical life varies depending on how it was derived and where it was derived. Table 1 contains value of statistical life from several agencies.
Table 1: Values of Statistical Life
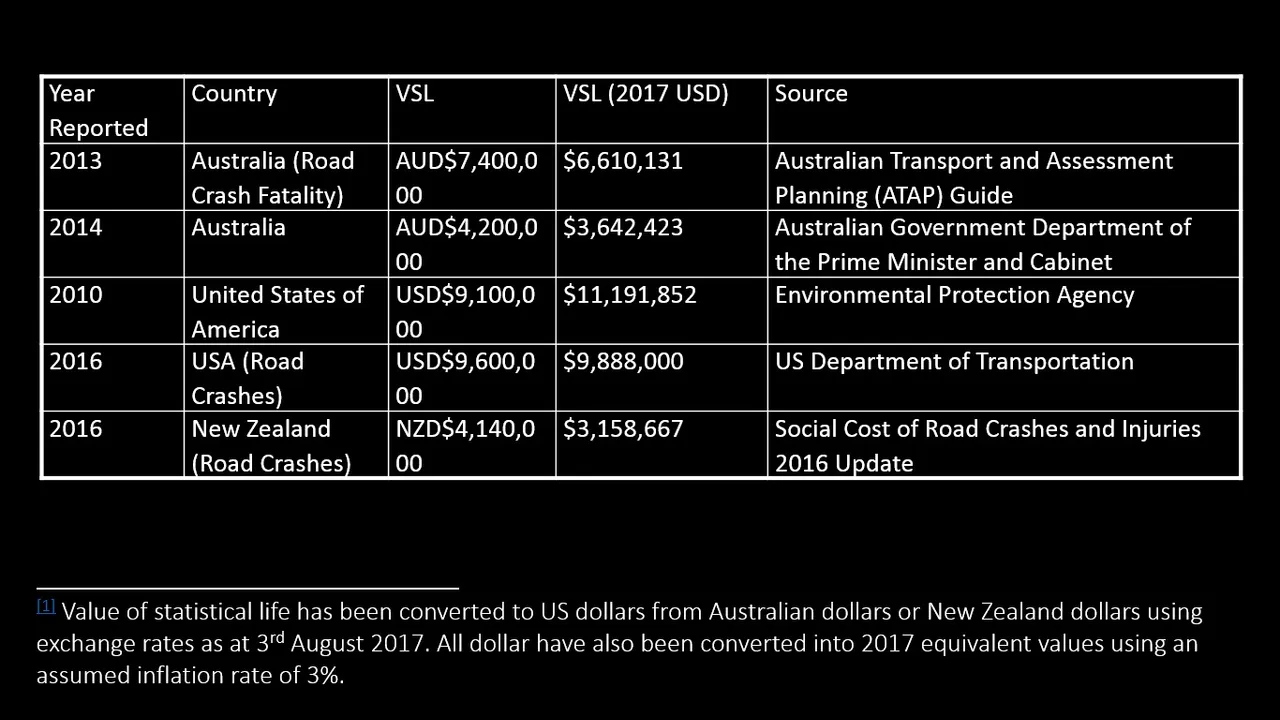
As can be seen from Table 1, value of statistical life can vary quite significantly. Values range from $3,158,667 to $11,191,852. For this post, I will use a simple average of the values in Table 1 as well as $3,158,667 and $11,191,852 as minimum and maximum values respectively. These values will be used to estimate values of statistical life for animals along with the Encephalization Quotient and average life expectancy.
The Encephalization Quotient is used to calculate the intelligence of animals based on the size of the brain and body weight. This approach produces some inconsistencies with some animals scoring lower than what is observable from behaviour and cognitive ability. This is apparent in pigs. Pigs appear to have very high intelligence but do not have a high brain weight to body weight ratio like some smaller animals do.
Even though Encephalization Quotient may not present a true reflection of intelligence for all animals, it appears to be the most reliable and consistent approach to determining animal species intelligence. This approach is also reasonably simple to combine with value of statistical life. The equations below describe how the Cephalization factor is calculated.
Cephalization Factor= (Brain Weight)/(Body Weight^X )
Where X is a number less than one. For this post 0.66 is used; some literature recommends 0.56 and 0.28 for primates.
Encephalization Quotient=(Cephalization Factor)/(Average Cephalization Factor of Mammals)
The body weight is to the power of X (0.66) as research has established that there is not a linear relationship between intelligence and brain weight to body weight ratio. Table 2 contains the body weights, brain weights, cephalization factors, and encephalization quotients for several animals.
Table 2: Encephalization Quotient
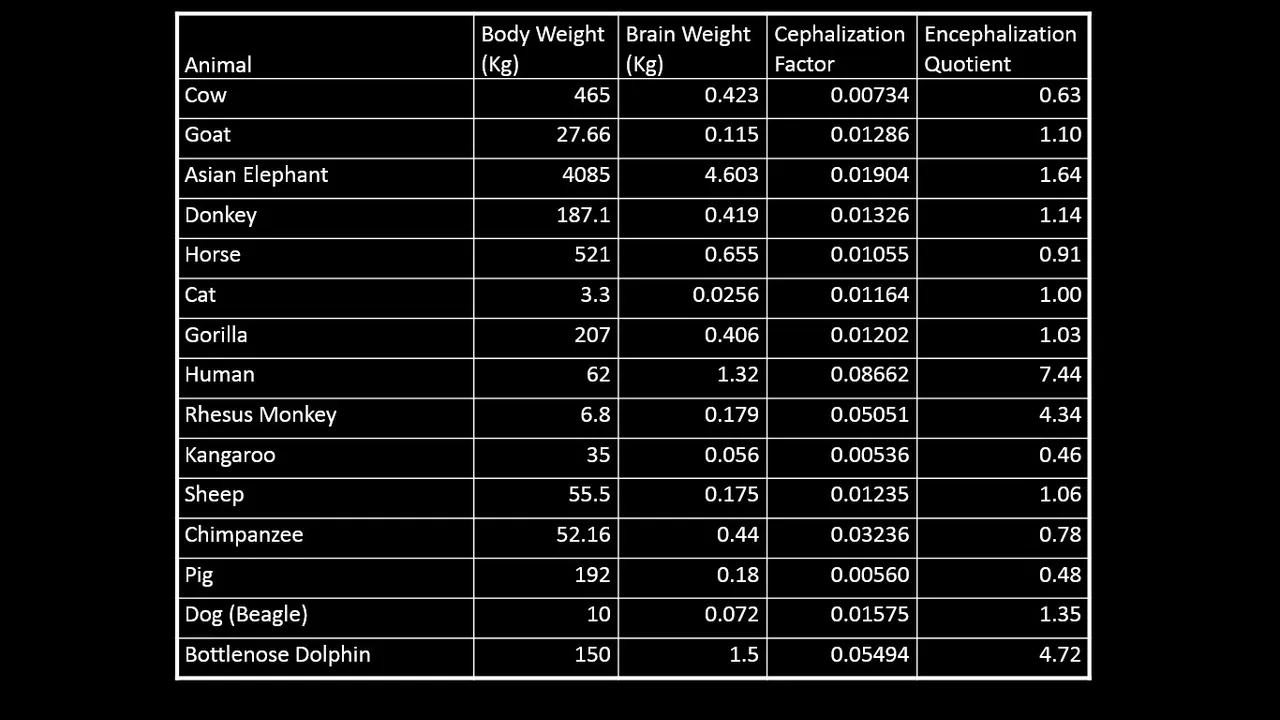
The encephalization quotient for humans was used as the base for calculating the encephalization quotient. The Encephalization Quotient of 7.44 for humans is consistent with journals and experts in the field (See https://www.revolvy.com/topic/Encephalization%20quotient and https://warrierviews.wordpress.com/tag/encephalization-quotient/).
The cephalization factor for humans was calculated using the data presented in Table 2 (1.32/(62^0.66)=0.08662). The human cephalization factor and the human encephalization quotient have been used to calculate the average cephalization factor for mammals, which has been used to calculate the encephalization quotients for the other mammals in Table 2. The formula used to calculate the encephalization quotients for the other mammals is as follows.
Average Cephalization Factor of Mammals=(Human Cephalization Factor)/(Human Encephalization Quotient)
The encephalization factors calculated in Table 2 are not intended to be precise but serves as a general comparison between animals for the purpose of determining the value of an animal’s life.
Life expectancy is also incorporated into the calculation of the value of statistical life of an animal. Life expectancy has been considered, as a longer life can yield more value for an animal. For example two animals may have the same level of intelligence but the animal with the longer life has more years to utilize that intelligence to obtain value in life. Therefore, life expectancy should be considered part of the value of statistical life equation for animals.
The value of statistical life of humans, the encephalization quotient and expected life expectancy are now used to determine the value of statistical life of animals. Table 3 contains the calculated statistical value for the animals in Table 2.
Table 3: Value of Statistical Life of Animals
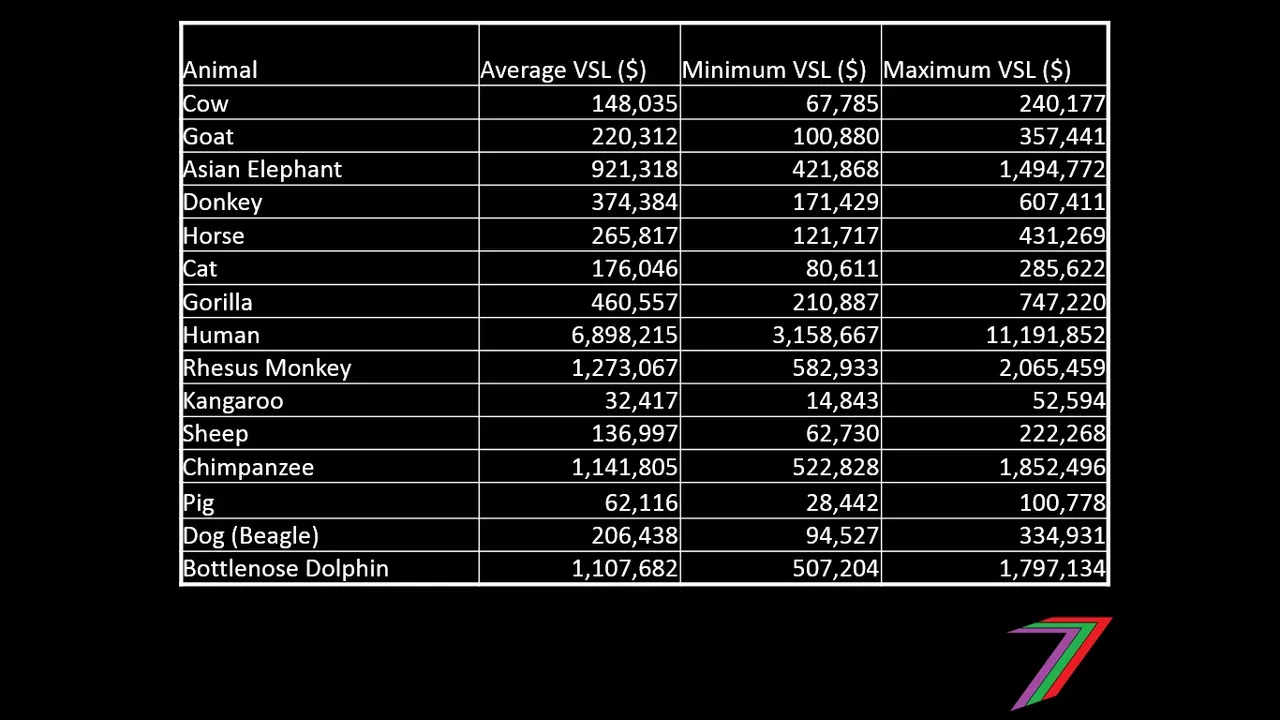
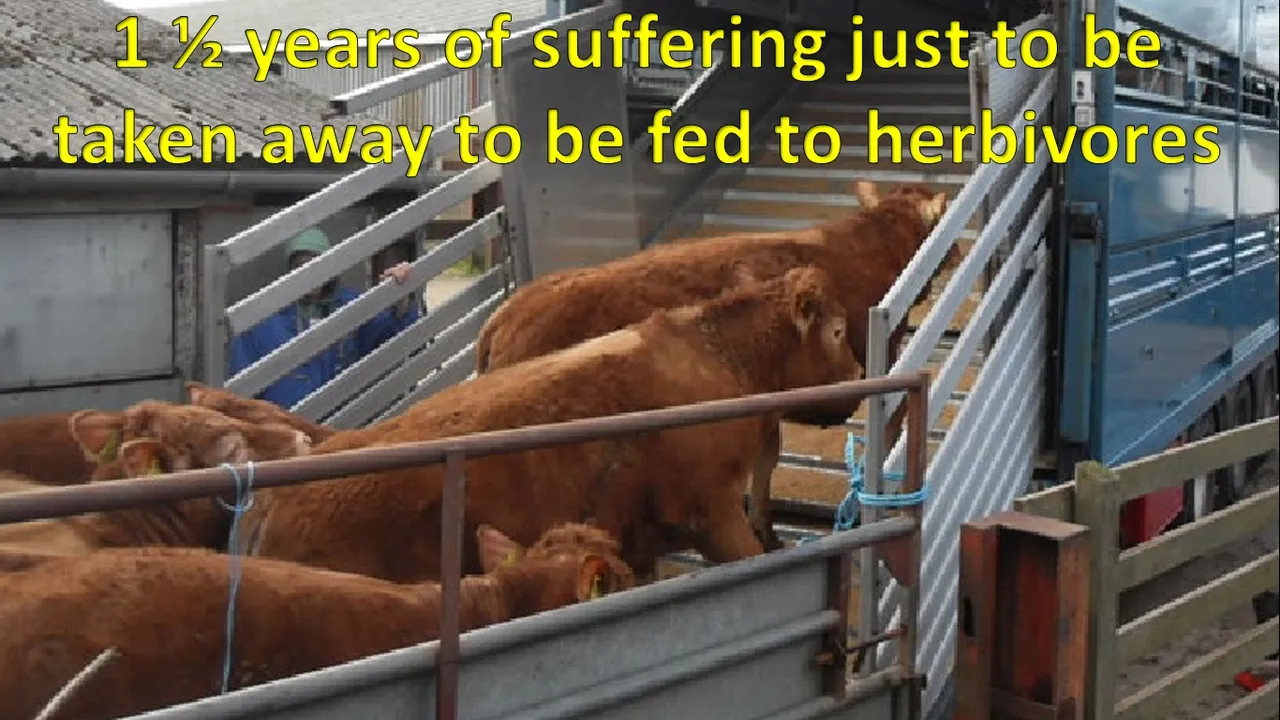
The values of statistical life in Table 3 should be considered as the intrinsic value of life to the animal and should be considered as an average across the life of the animal. These values do not factor the exact age of death or the extrinsic value the animal adds to the environment. If the life of the animal is being cut short through abuse or slaughter the value of statistical life will be higher. For example the average value of statistical life of a cow expected to live until 20 is $148,035. If assume that the average age of a living wild cow is 10 years (20/2); we can assume that the cost of $148,035 represents the cost of 10 years of a cow’s life. If cow’s are slaughter at 1 ½ years, the loss of life needs to represent 18 ½ years rather than 10 years. The cost of life for a slaughtered cow would therefore be $273,866 ($148,035 × 18.5/10), rather than $148,035. The cost of life will be calculated in a similar manner for other animals that have a different life expectancy due to human intervention.
Value of the loss life and cruelty to a race horse
According to my calculations in Table 3, the average value of statistical life of an average aged horse is $265,817. If we assume the average age of a race horse should be 12 ½ years, the $265,817 represents the loss of 12 ½ years of life. Race horses on average only live to 5 years. Therefore, a loss of 20 years of life needs to be considered instead of 12 ½ years. The value of the loss of life of a race horse should therefore be $425,307 (265,817 × 20/12.5).
The quality of life experienced by a race horse is well below what a horse in the wild would experience. According to Animals Australia, most race horses show signs of both physical and mental trauma. Race horses have been found to have stomach ulcers (89%), skeletal injuries, torn ligaments and tendons, and dislocated joints. Horses show signs of mental distress by crib-biting, making distressed noises, and even mutilate their own bodies.
Based on both the video footage and documented evidence by several activist organisations, let’s assume that the quality of a race horse’s life is reduced by 50% from being kept in captivity and being trained as a race horse. We can calculate the cost of cruelty to the race horse over the race horse’s 5 year expected life. First we need to calculate the cost of cruelty per year for a horse by dividing the value of statistical life of a horse ($265,817) by the expected average life of living horses (12 ½ years) and then adjust for the 50% reduction in quality of life, see equation below.
Cruelty cost per a year for a horse = (VSL horse × 0.5)/expected average life of living horses
= $265,817 × 0.5 / 12.5 = $10,633
As a race horse lives on average just 5 years in captivity, the cost of cruelty over the life of an average race horse is $53,163 (10,633 × 5).
The cost of horse racing to each horse, based on my calculations, is $425,307 for loss of life and $53,163 for cruelty for those years that the horse is alive. Therefore, the total costs of loss of life and cruelty per a race horse is $478,470.
Value of the loss life and cruelty to race horses over a year in Australia
According to Animals Australia, approximately 25,000 race horses are killed for meat and exported each year. In Australia, using the value of loss of life per horse ($478,470), the cost of the loss of life of race horses in a year is approximately $10.6 Billion ($425,307 × 25,000 = $10,632,676,476).
According to Animals Australia, there are approximately 31,000 thorough breed race horses in training in Australia. If assume a 50% loss of quality of life because of abuse, the costs of cruelty per year in the Australian race horse industry is $329.6 Million (10,633 × 25,000 = $329,612,971).
The overall cost of the loss of life and cruelty in the race horse industry in Australia amounts to approximately US$11 Billion based on my calculations of the value of life and cost of cruelty.
Many people that support horse racing by attending the events or bet on horse racing are not aware of the cruelty that goes into the horse racing industry. Cruelty to horses does not even end with horse racing. There is cruelty to horses taking placing in various other events and activities as well. These include show jumping, dressage, rodeos, backyard breeding, and even proclaimed natural horsemanship. I have focused on horse racing because of the extent of its popularity. I will dedicate other posts in future to the cost of abuse from these other events and activities.
What is the net effect of horse racing?
Part of this series highlighted the costs of gambling to the public and the gains to the bookmakers. Part 1 also looked at the costs and benefits to those enjoying the horse racing related festivities. Table 4 briefly summarises the 2016 expenditures on the Melbourne Cup that are touted by the media as benefits of the event.
Table 4: Summary of expenditure relating the Melbourne Cup 2016
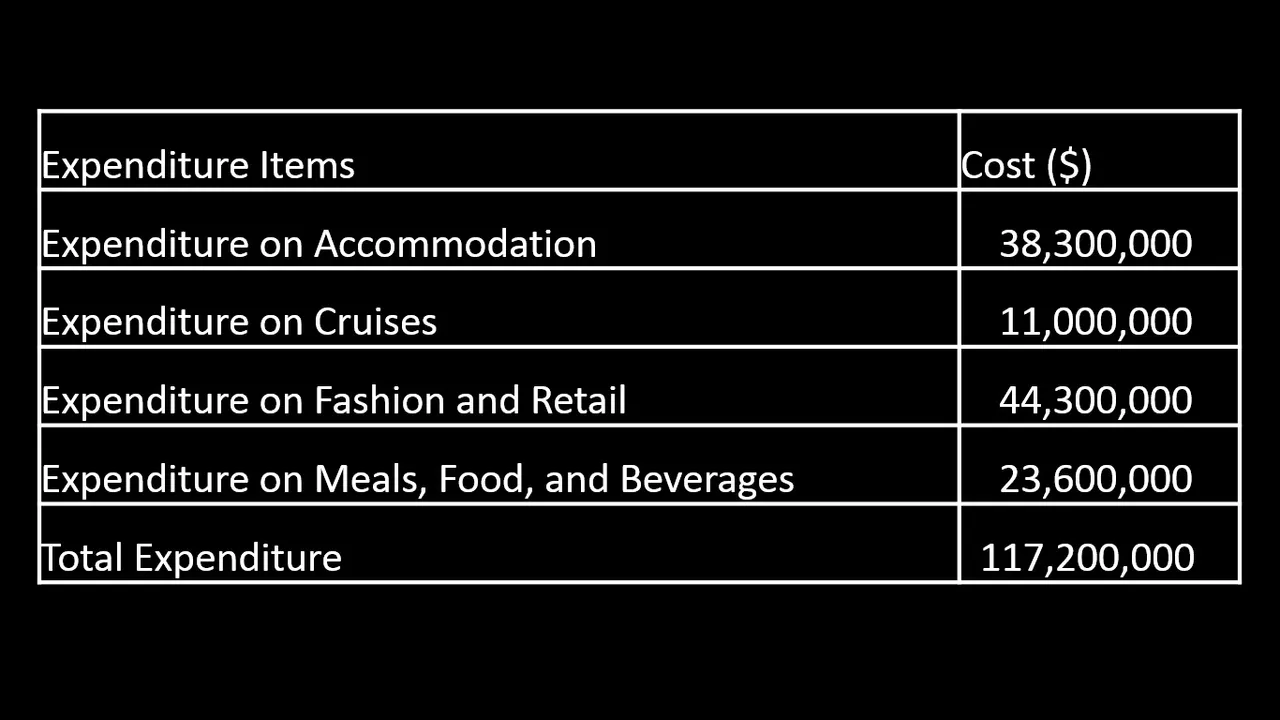
Source: flemington.com, accessed on 27/11/2017
The above expenditure offers those paying some enjoyment. The extent of this enjoyment is difficult to value as we do not know the enjoyment that would been achieved from alternative activities that these people would have engaged in (opportunity costs) if the horse racing event did not take place. Even if the expenditure achieved a 100% consumer surplus in excess of opportunity costs, the value of the benefit ($117.2 Million) does not even come close to the cost of the loss of life and cruelty to horses ($11 Billion) over the course of a year.
Part 1 concluded that the net effect of horse racing on humans is most likely negative. If benefits to bookmakers, major retail outlets, horse breeders and government are excluded, the net effect of horse racing is certainly negative. When we include the costs to horses, the combined net effect of horse racing on humans and horses is strongly negative.
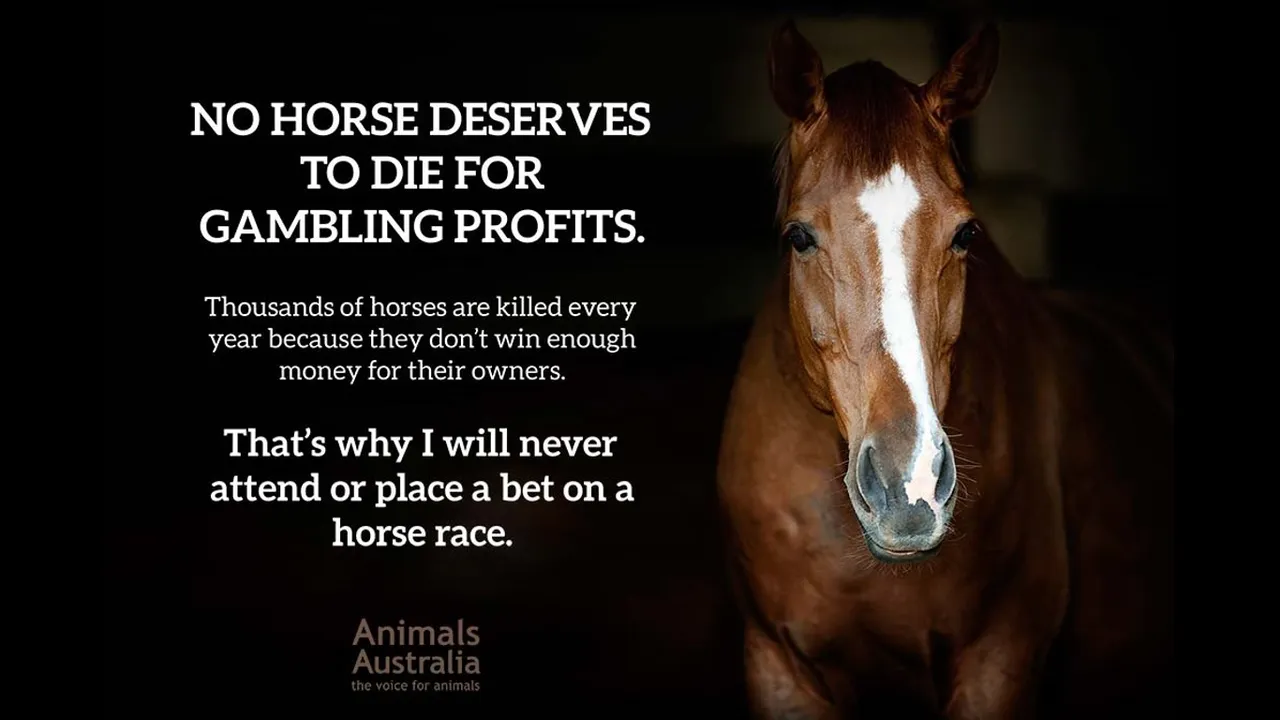
Source: Animals Australia
Conclusion
Horse racing is an industry that exploits both humans and horses for profit and for the benefit of the few. It is also unlikely that horse racing is going to be stopped any time soon. The profits from horse racing is excessively high. There are several billionaires that hold very large stakes in horse racing. These powerful individuals have great influence over government, they will not allow horse racing to be banned.
If horse racing is to end. The people need to stop supporting it. If the betting and festivities stop. The profitability of horse racing will go down. If profits go down so will investment in horse racing and horse breeding. Do not rely on government to do anything. The continuation of the horse racing industry is currently in Governments’ best interests, it will remain that way as long as the industry is profitable.

This brings me to the end of this post and series. The content of this post will be included in some form in my upcoming book ‘Vegan Economics’. The content presented is in draft form and will be expanded upon for the book. I hope you enjoyed this post and my series on horse racing.
Other Vegan Economics posts
I have mentioned in some of my other posts that I am writing a book with the working title ‘Vegan Economics’. I will, as the book progresses, include sections of the first draft in Steemit posts. I posted ‘My Vegan Story’ in two parts, which will be included in the book. The links to these posts are as follows, Part 1: @spectrumecons/vegan-economics-my-story-part-1 and Part 2: @spectrumecons/vegan-economics-my-story-part-2.