
Hi Everyone,

Welcome to the ‘Buying and Selling Game’ Contest 31 results post. This post contains a video of the ‘Buying and Selling Game’ Excel Model generating the selling prices for each type of electric cleaning equipment for each town described in the initial question.
Winner determined in this video

What is the Buying and Selling Game?
For the benefit of those who have not entered this contest, here is a brief explanation of how the game works.
Participants are required to buy goods with an allocated amount of money. They are given a choice of 6 goods and all these goods are available in any of the 5 towns, cities, islands or planets in the game. The buying prices of all goods are provided in the question.
The participants are then required to sell all of their goods on a future date. The selling prices for all goods in all towns, cities, islands or planets are not provided. Instead, the question provides a triangle distribution for the selling price of each good in each town, city, island or planet. For the triangle distribution, the minimum, maximum, and mode values are provided.
The participant who has the most money after selling all his or her goods is the winner.
Responses to the contest are made in the comments section of the post. If several participants make the same amount of money, the person who entered (commented) first will win. The account with the winning entry will receive 30 Hive and the first 12 entries will be given upvotes. The most profitable buying and selling price combination is also calculated. If the winner adopts this strategy, he or she will receive an additional 5 Hive. If nobody makes a profit (i.e. zero or negative), the prize will be rolled over to the next contest.
The format of the required entry is explained in detail in the contest itself.
For a more detailed explanation, you can access the contest post using the following link.

Results of the contest
Table 1 contains the selling prices generated by the ‘Buying and Selling’ Game model for each type of electric cleaning equipment in each town.
Table 1: Selling prices of all electric cleaning equipment in each town
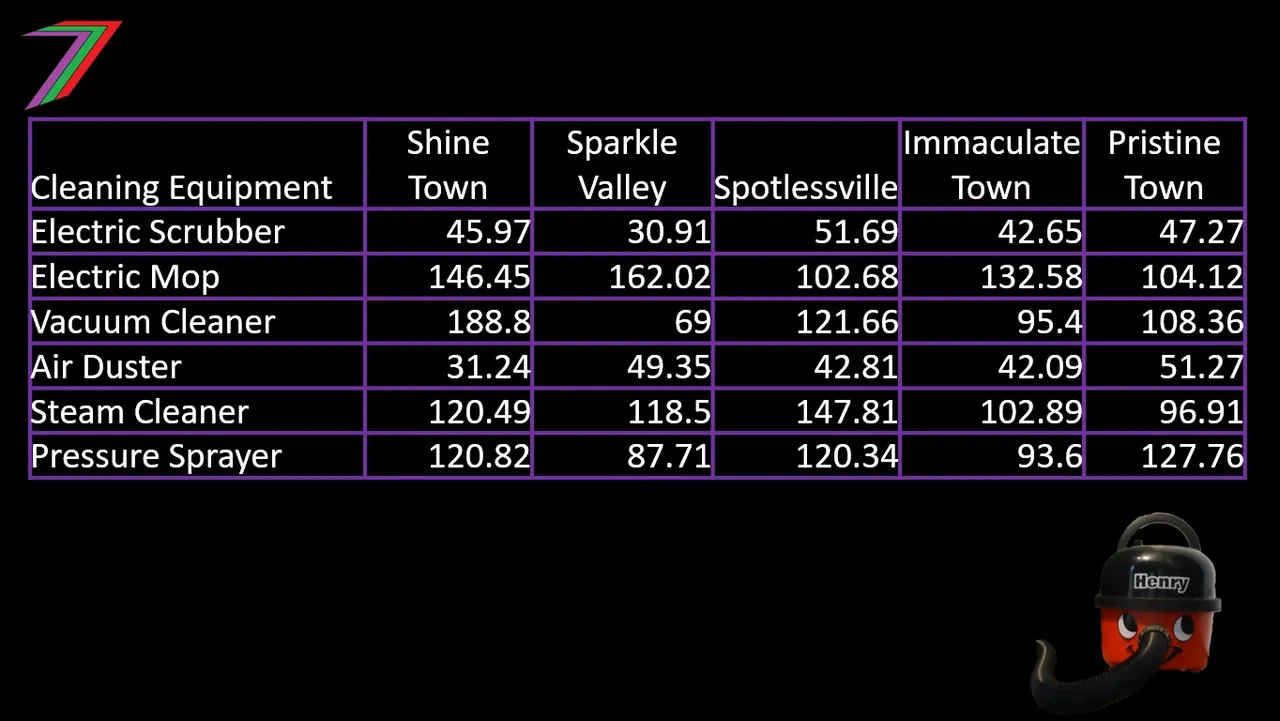
Table 2 contains responses and the profit made by each participant.
Table 2: Participant responses and profit
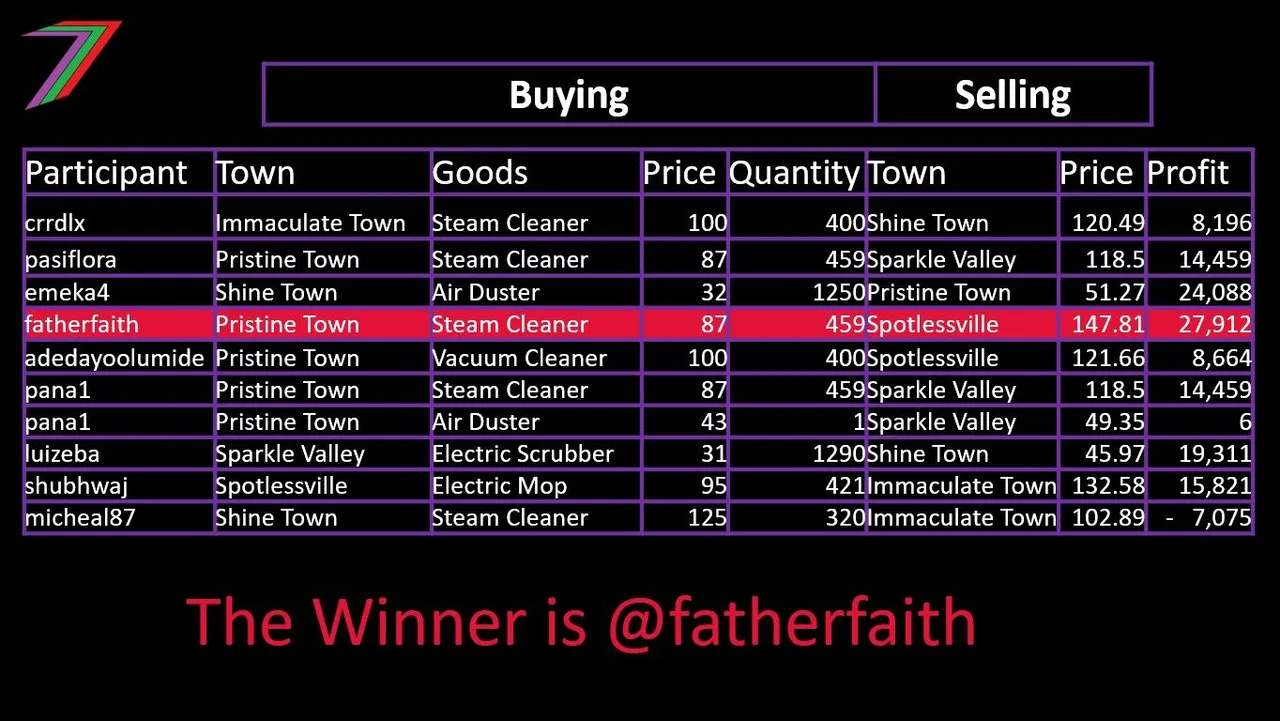
Congratulations to @fatherfaith for winning Contest 31 of the 'Buying and Selling’ Game and a prize of 30 Hive.
In Pristine Town, he bought 459 steam cleaners for $87 each. He paid a total of $39,933.
In Spotlessville, he sold the 459 steam cleaners for $147.81 each. He received a total revenue of $67,845 Therefore, he made a profit of $27,912(67,845 – 39,933).
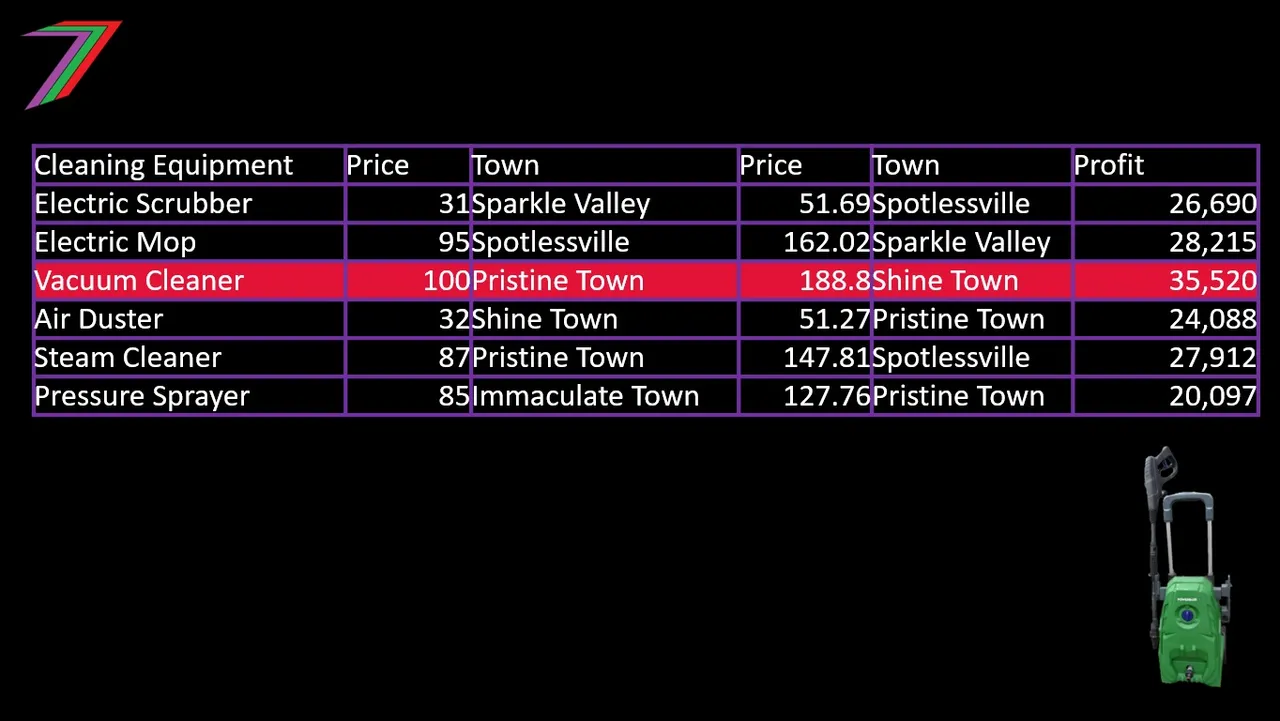
Highest possible profit
Unfortunately, @fatherfaith did not win the bonus 5 Hive for highest profit possible for this game. The strategy that would have generated the highest profit would have been to buy 400 vacuum cleaners from Pristine Town at $100 each and then selling them at Shine Town for $188.80 each (as generated by the model). This would have generated a profit of $35,520.
Table 3 contains the lowest buying prices, the highest selling prices and the highest profit for selling each type of electric cleaning equipment.
Table 3: Lowest buying price and highest selling price
I would also like to thank @crrdlx, @pana1, @emeka4, @adedayoolumide, @pasiflora, @luizeba, @shubhwaj, and @michael87 for participating.
Tips for future games (If you want to participate in the next contest, I strongly recommend you read this section of the post)

To achieve the best chance of winning the game (i.e. earning the highest profit). Participants need to make the best use of the information they are given. The participant should buy from the place that sells the good at the lowest price and sell at the place that will offer the highest price.
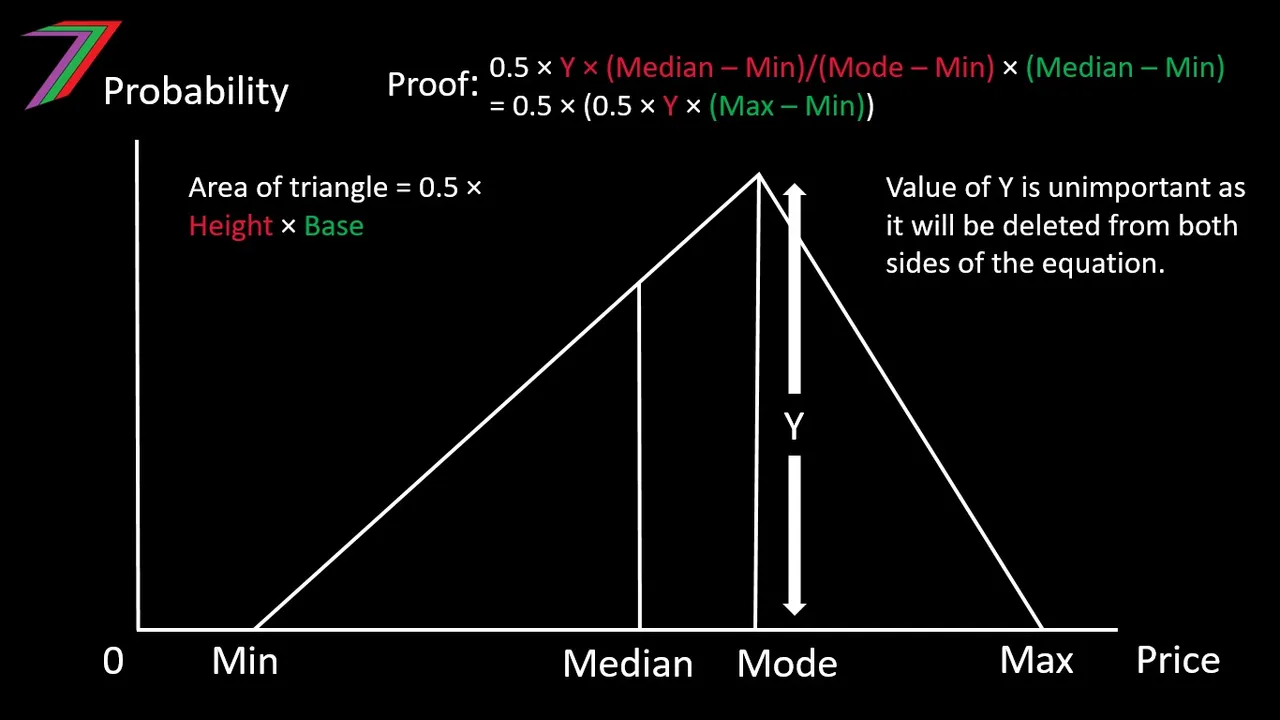
To inform the decision further, participants should also consider the mean and median prices for each good in each place. The mean and median for a triangle distribution can be calculated using the following formulae.
Mean = (Minimum + Maximum + Mode)/3
Median when Mode ≥ (maximum – minimum)/2 (i.e. mode closer to maximum)
Minimum + (((maximum – minimum) × (mode – minimum))/2)0.5
Median when Mode ≤ (maximum – minimum)/2 (i.e. mode closer to minimum)
Maximum - (((maximum – minimum) × (maximum – mode))/2)0.5
Proof Median
More posts

If you want to read any of my other posts, you can click on the links below. These links will lead you to posts containing my collection of works. These 'Collection of Works' posts have been updated to contain links to the Hive versions of my posts.


Hive: Future of Social Media

Spectrumecons on the Hive blockchain

▶️ 3Speak