As the project is one of the projects that I like, despite only having a few hundred ALIVE, I decided to create a weekly report where we can follow the evolution of the token's tokenomics.
Why weekly and not daily?
Because I think a daily post about this, it will be like spam.
Thanks to @flaxz, now I have the corrected data.
From now on, the displayed data will be according to the ALIVE frontend.
ALIVE
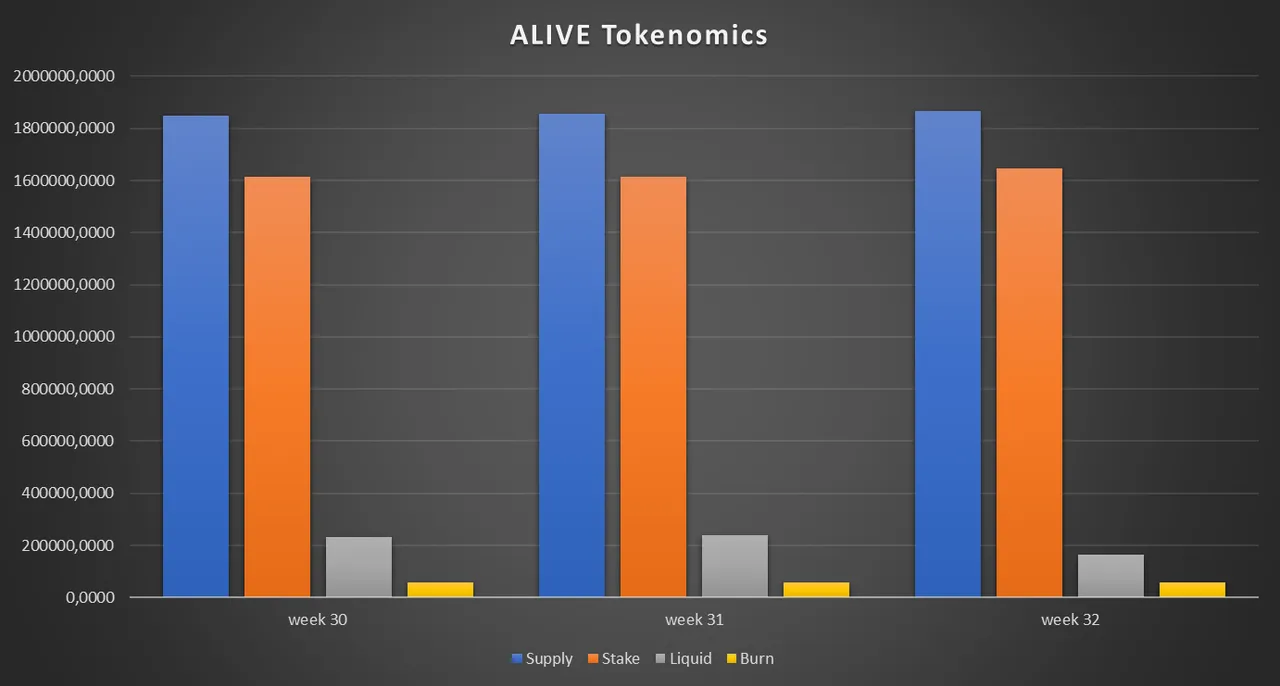
| Supply | Stake | Liquid | Burn | Holders | |
|---|---|---|---|---|---|
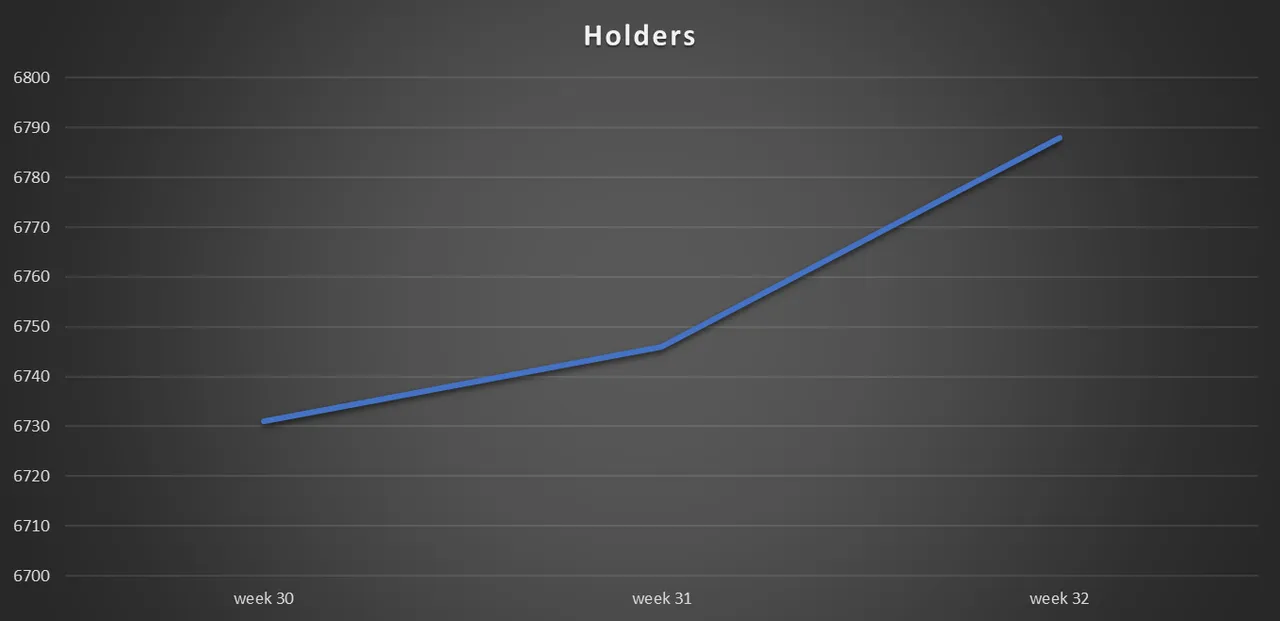
| week 30 | 1848004,4914 | 1614706,1375002 | 233298.3539 | 56526,7498 | 6731 |
| week 31 | 1854532,4183 | 1615640,8979002 | 238891.5204 | 56871.7498 | 6746 |
| week 32 | 1867973,2106 | 1646079,7828 | 164442,678 | 57450,7498 | 6788 |
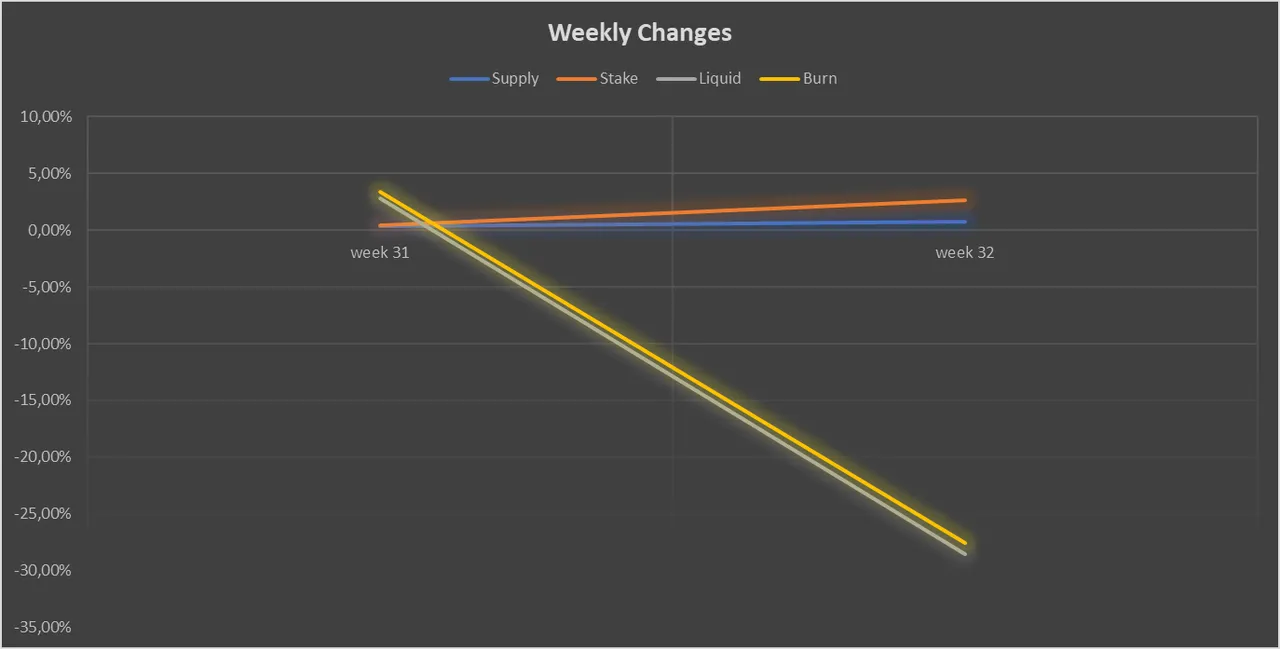
Comparing with the previous week, we have 133440.7923 increase in supply, 30438.8849 more ALIVE staked, less 74448.8424 ALIVE liquid, more 579 ALIVE burned and 42 new holders.
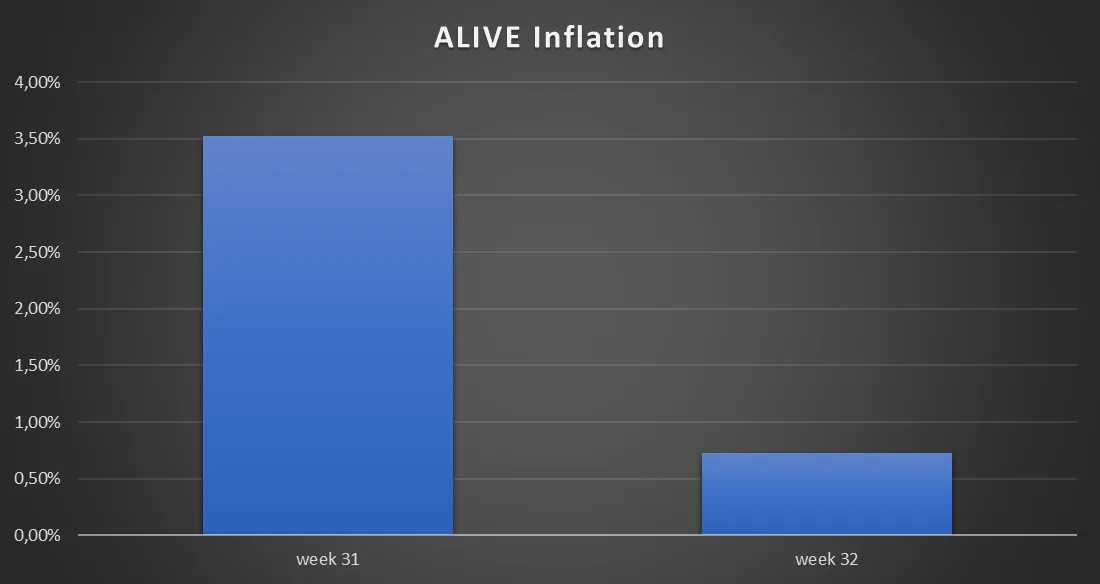
This means our supply increased 0.72%, the ALIVE staked increased 1.88%, the liquid ALIVE decreased -31.16%, ALIVE burned increased 1.02% and holders increased 0.62%.