
Good day Hiveians!
Join me in analyzing the crypto markets!
Hive has been steadily falling relative to BTC
3 weeks ago we last looked at this pair, and it did not look to good for Hive. But looking at the chart again made me realize that I probably made a mistake in the last analysis. It is not that great, but I think it's enough to warrant an update. My main idea still holds: we can see a strong 3 wave pattern in the chart.
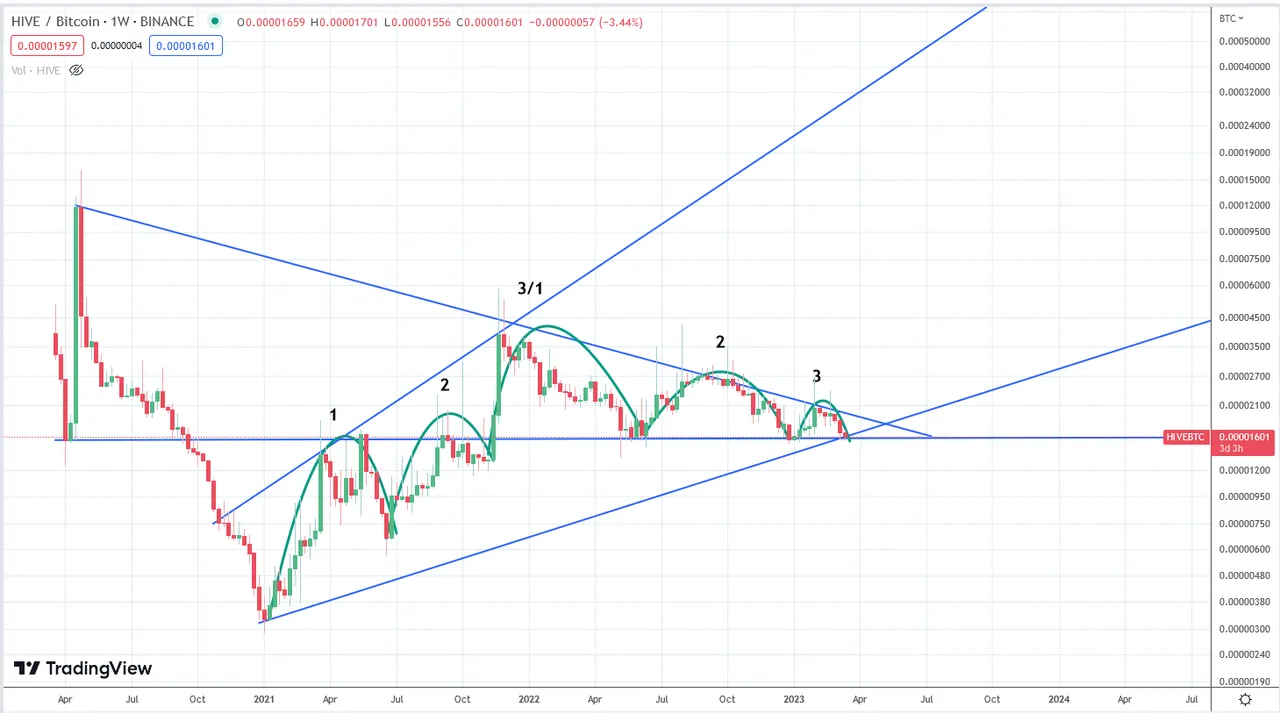
You can check out the chart on different scales and see more of this 3 wave pattern. It is not entirely unique to this pair, but I have not seen it stronger anywhere. This is why I think we can use it to somewhat predict the future price movement. If so, we can see that the last wave, the "3", is now coming to an end. As often it was more prolonged as I thought which is why I need to update it here:
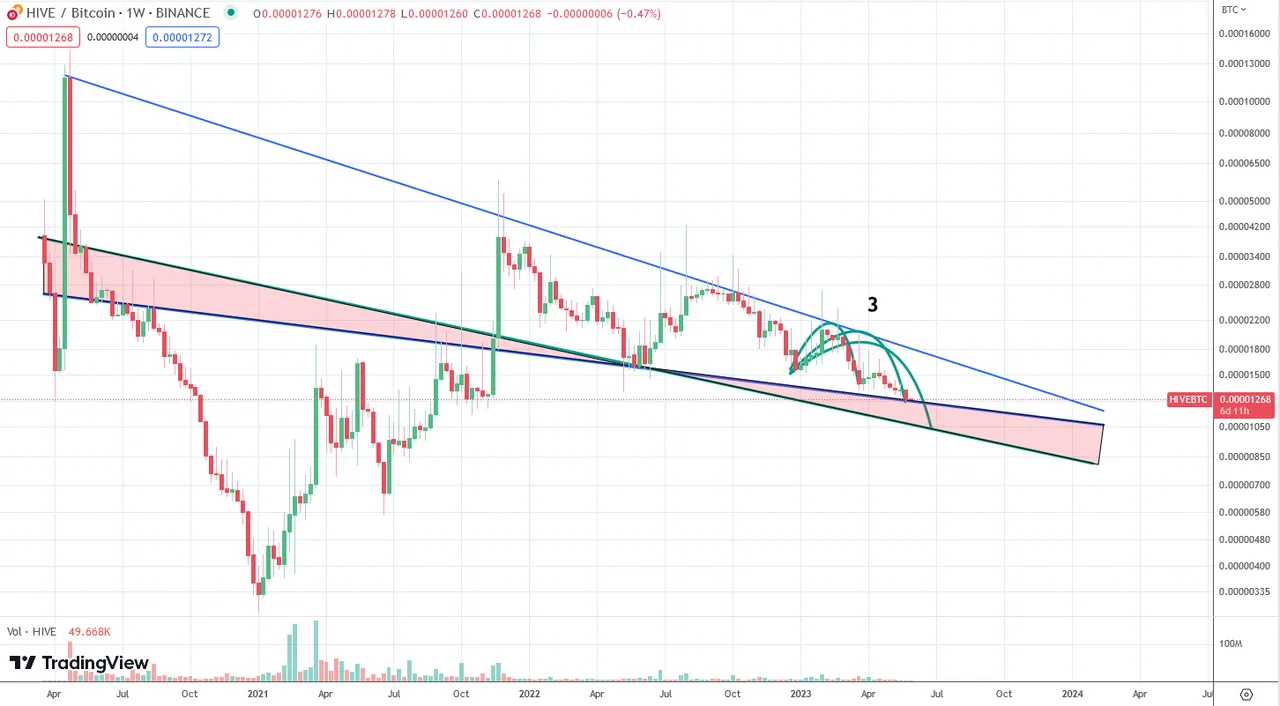
I am just focusing on the 3rd wave here and its potential bottom. What you can see here in greater detail is the last wave's reach as well as the potential supporting trend line for it. If the top of the red triangle to the right does not hold I would expect a drop to the bottom of it. This would be about another 16-18% drop which coincides with Hive dropping to about 30 cents which is its macro support (see my other post for more details).
The first chart I posted looks a lot nicer in the sense that the supporting trend line is horizontal which would leave much more room for price moving upwards. What we are now facing is a falling wedge which is in itself actually potentially bullish. But it is also clear that Hive is struggling to keep its value relative to BTC. Both of the supporting trend lines drawn in this second chart could still work: they could be the bottom from which price reverses and moves upward again. Anything lower than the support I have drawn does not work in my opinion. At least it does not suggest an obvious bottom for the price. In other words the price would be in "free fall".
I will give you some reasons for both support lines. I am undecided which it will be, but I think the least likely scenario is that price breaks through both supports.
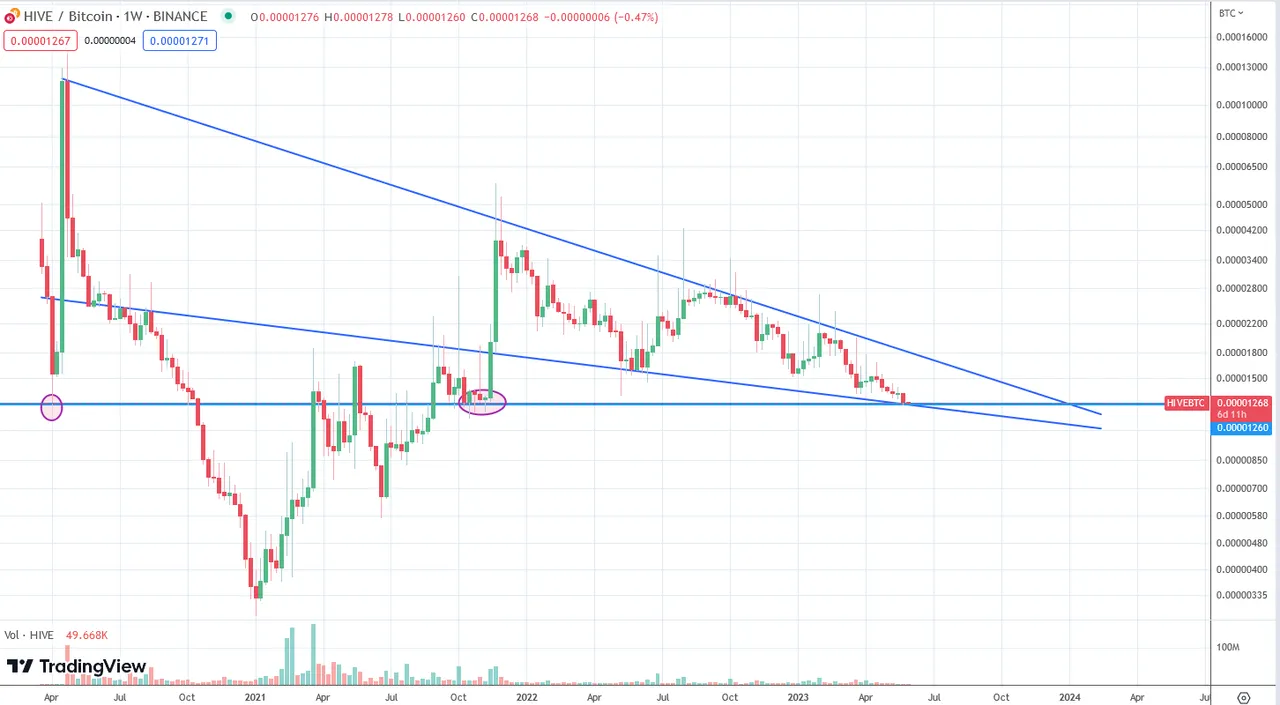
- The top support line. First, if we see another drop the 3 wave pattern gets diluted. At current levels it still falls very good in line with the observed pattern which is not strong evidence, but it is still something that should be considered. Second, the current price level has a very good horizontal support. It falls in line with the first bottom in 2020 as well as the base of the last wave of the impulse wave, marked here:
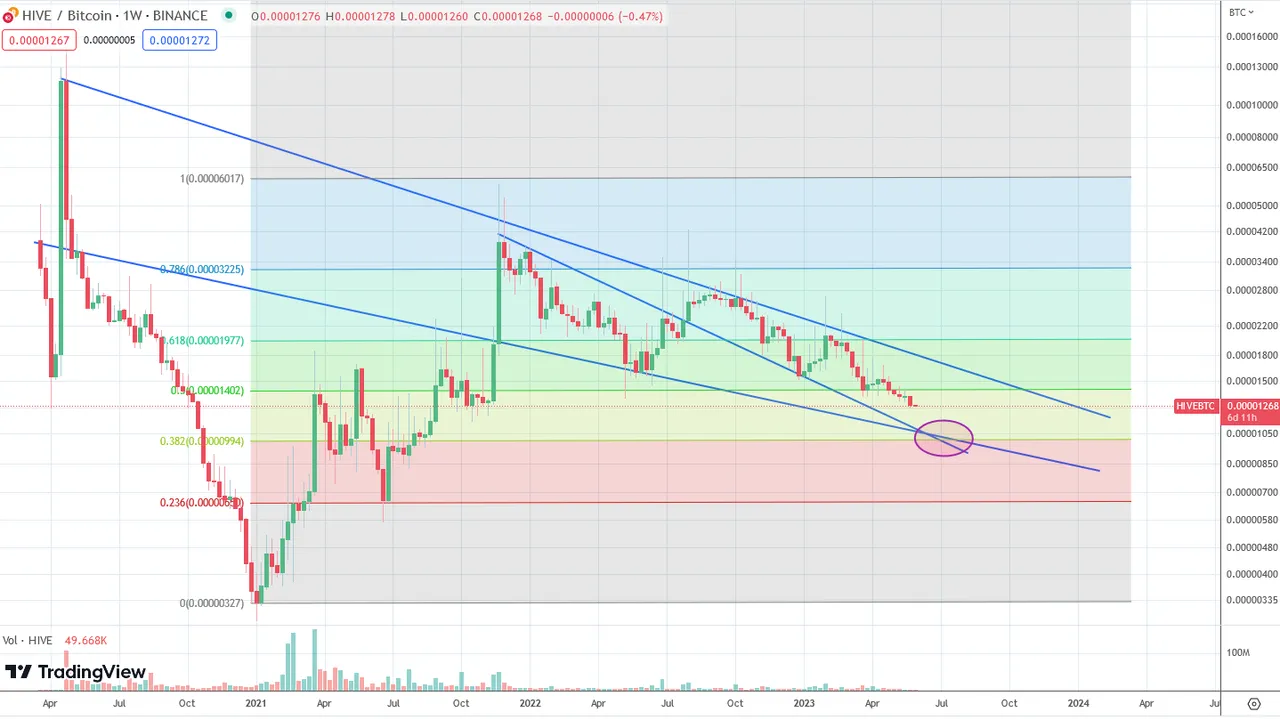
- The bottom support line. First, we can draw a trend line from the top of the impulse wave in 2021 and to the bottom of the second wave. This gives us often a good indication of where price will bottom out. Second, I have noticed that the price ratio coincides with the 0.382 to 0.5 ratio. If so, the bottom for this area is at 0.00001. Both supports even intersect with each other which is a good predictive sign.
As a general reminder: Please keep in mind that none of this is official investment advice! Crypto trading entails a great deal of risk; never spend money that you can't afford to lose!


Check out the Love The Clouds Community if you share the love for clouds!