
Crypto has really taken off since August 1st with Bitcoin making all time high after all time high, the price of Bitcoin as of the time of writing is $3891.30, today i did an analysis on the EUR/USD pair, below is the daily chart.
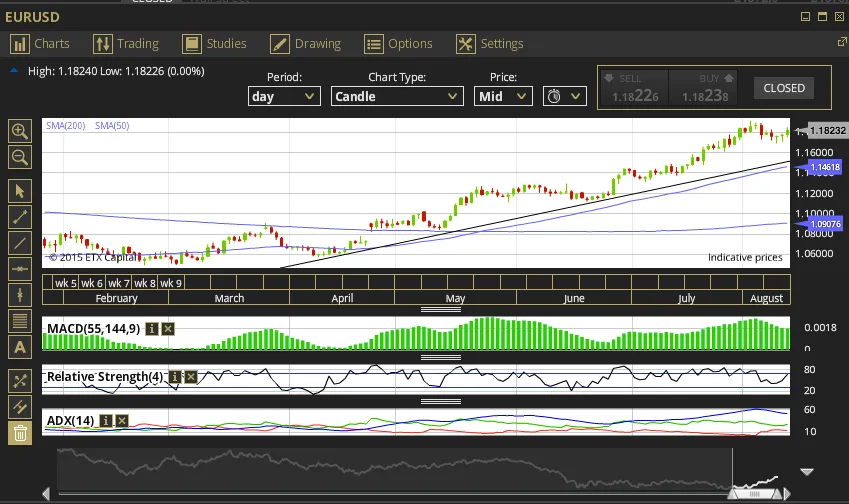
Daily EUR/USD
I have been anticipating a pullback for some time now and it is still yet to happen as you can see the EUR/USD has been on a bullish run for some time now mainly due to a weak dollar, momentum has begun to weaken but is still strong with the RSI approaching an overbought signal.
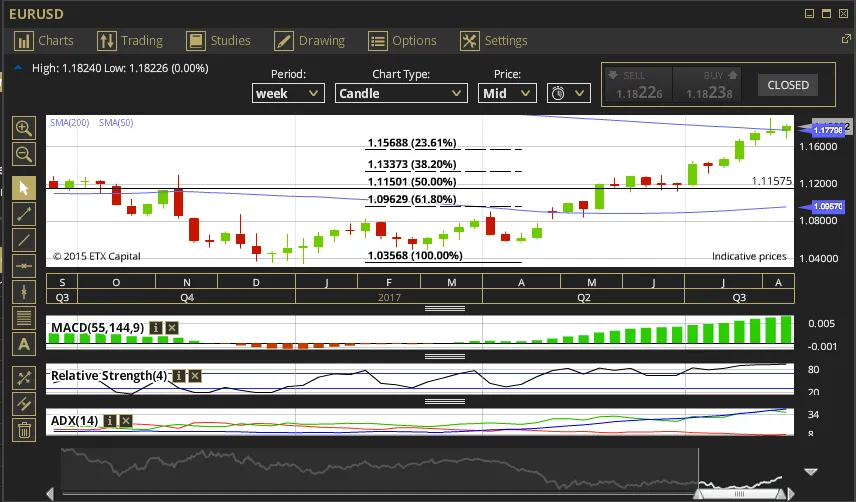
Weekly EUR/USD
Above is the weekly timeframe, notice how we are hovering around the 200 SMA which is a key indicator for big institutions, we have closed above it but not in a very convincing manner, the weekly chart is screaming for a pullback and with Bitcoin peaking right now i would anticipate a pullback to coincide in both markets in the coming weeks.
P.S. If you are a minnow with low SP check out Steemfollower to increase your rewards.