
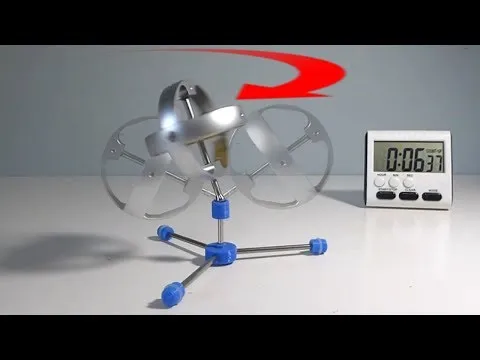
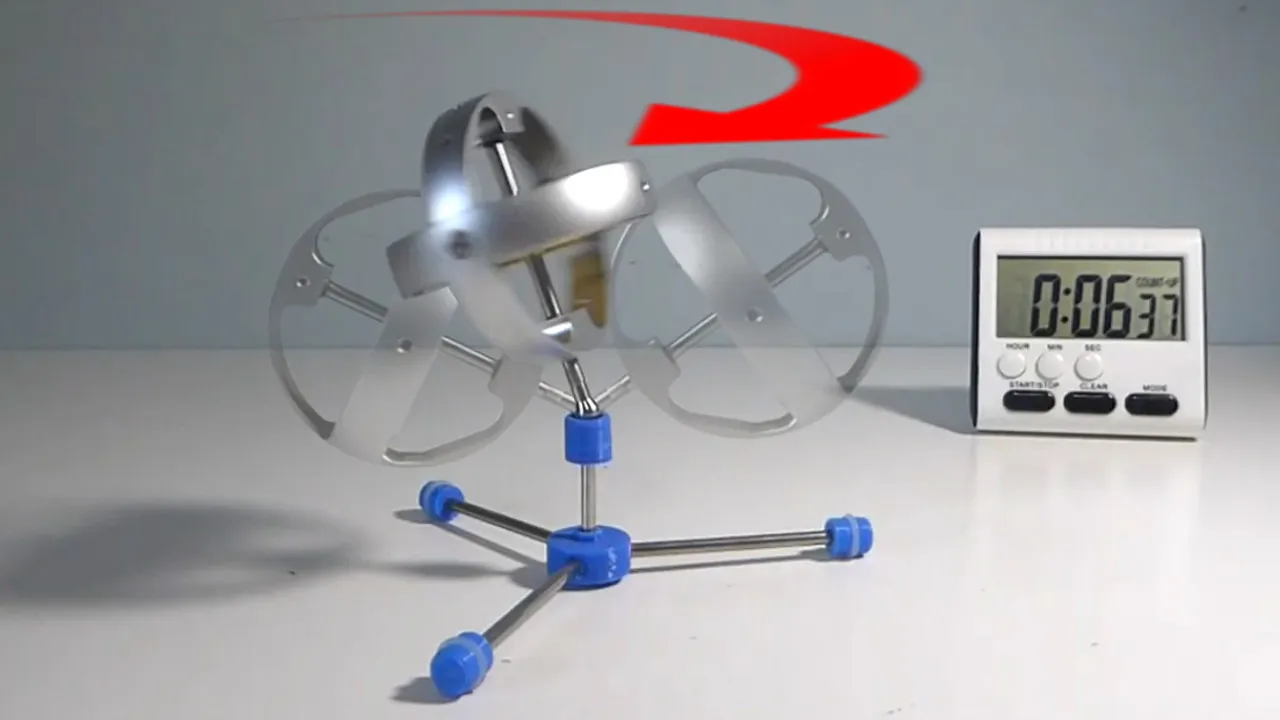
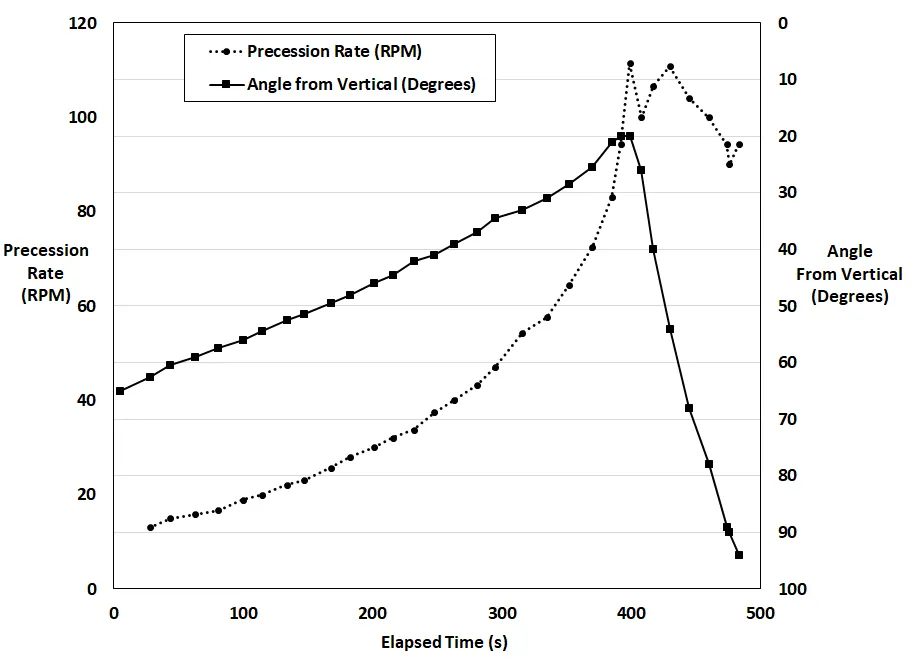
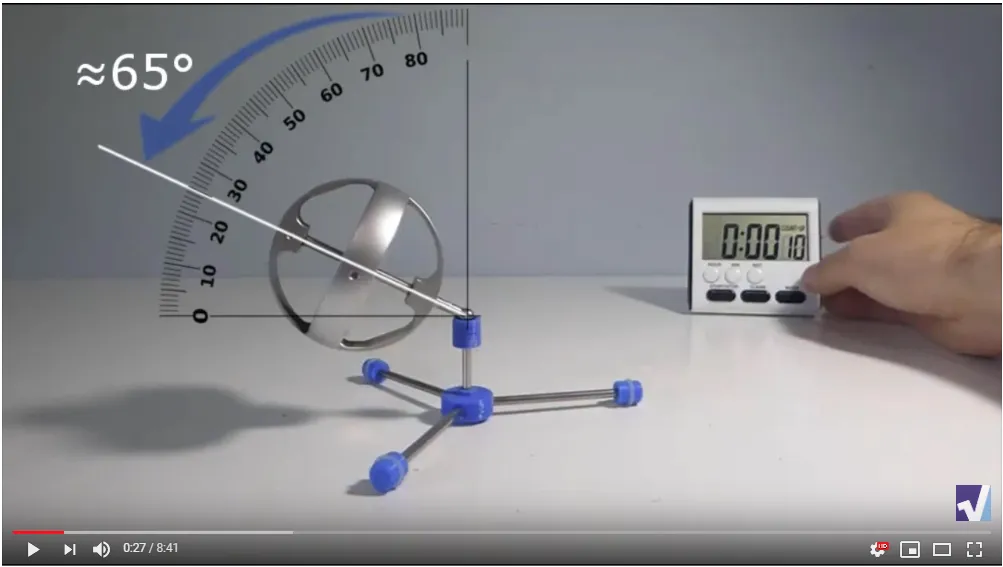
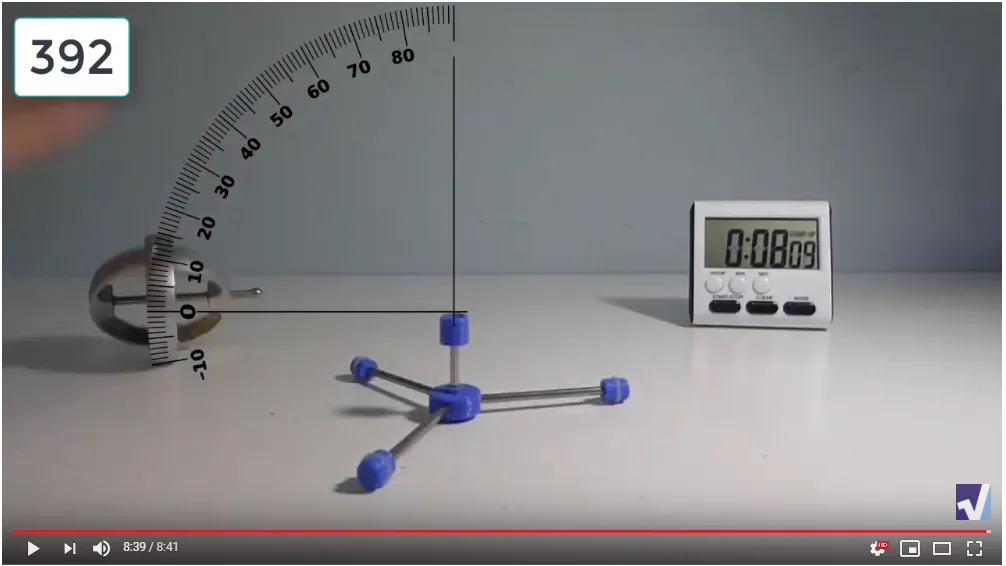
In #MESExperiments 15 I go over the process of very tediously measuring a gyroscope’s angle of steepness for each precession revolution in order to analyze and learn from the data. This specific gyro test had a starting angle of 65° from the vertical and rose 45° to a final risen position of 20°. I chose this specific gyro experiment to analyze because I wanted to compare the peak risen position with the precession rate or period, which in our case is defined as the number of precession revolutions per time (I used per minute hence RPM).
The data was compiled in the following Excel spreadsheet:
https://1drv.ms/x/s!As32ynv0LoaIh_JNJ8foLHD9vY433A?e=ffHY2v
Retrieved: 22 August 2019
Archive: Not Available
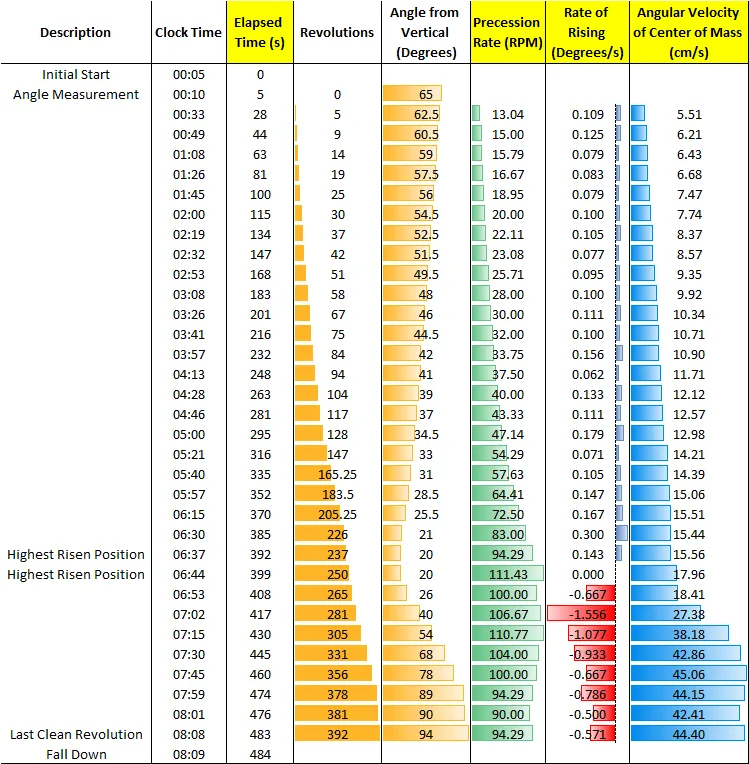
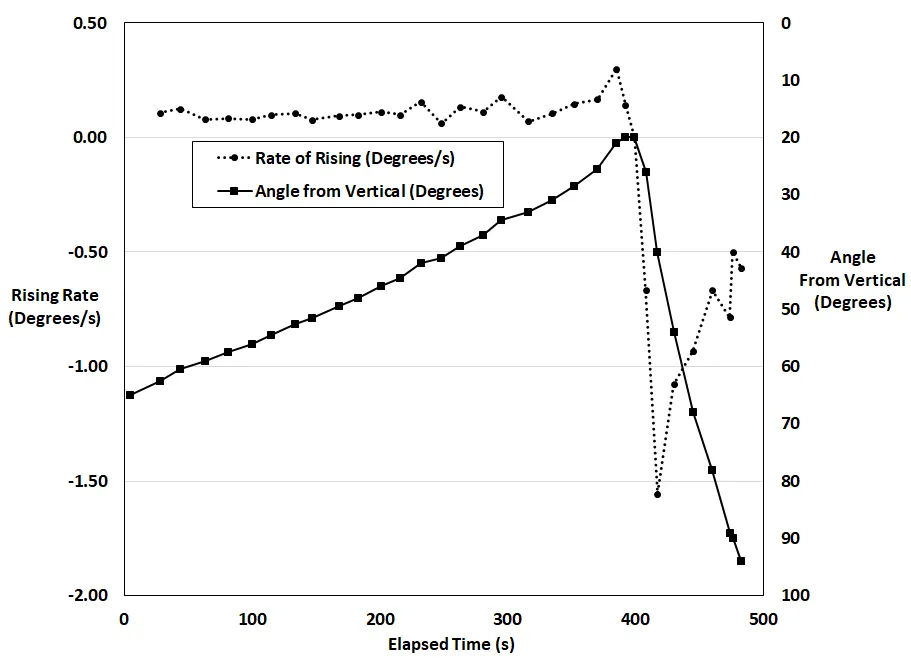
Analyzing the data shows that the angle from vertical tends to increase linearly while the precession rate or period increases more rapidly and is akin to an exponential rise. This pattern is followed until the gyro is at its highest risen position. Soon afterwards the gyro starts to descend downwards at a very fast rate and then its falling rate starts to slow down as the angle gets more steep. Likewise, just after the highest risen position the precession rate drops quickly but interestingly is sped back up again followed by a gradual slowing down as the gyro angle gets steeper.
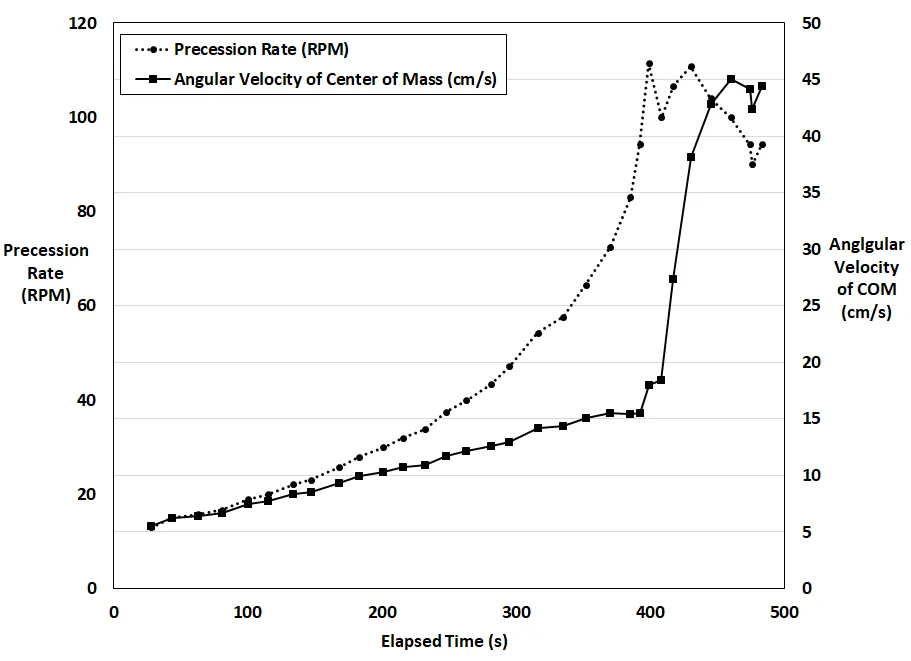
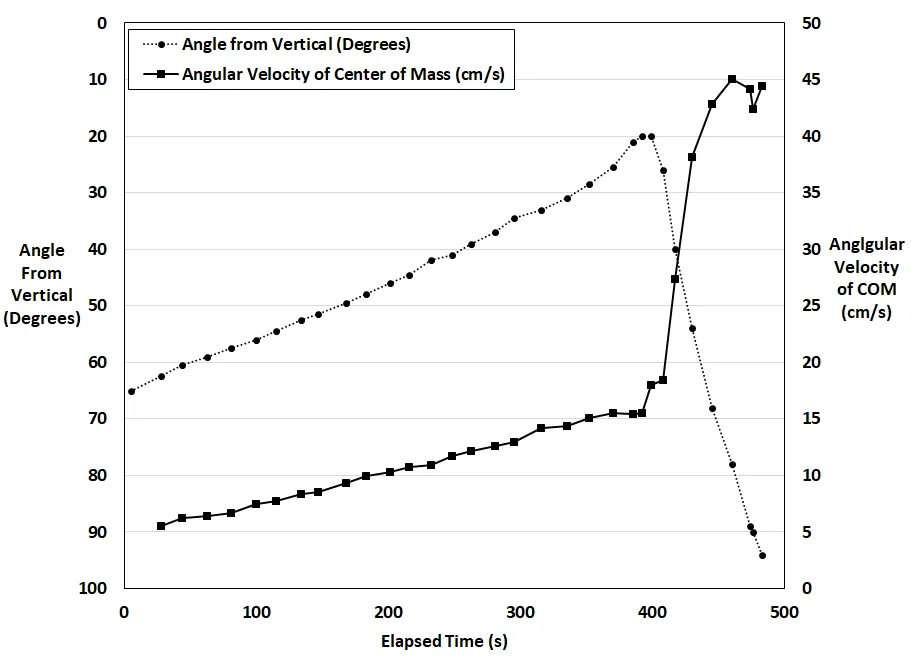
Furthermore, I calculated the angular velocity of the center of mass of the gyro while assuming it was at the center of the gyro rotor. Interestingly, the angular velocity initially increases linearly and at a much less rate than the exponentially rising precession rate. But once the peak risen position is reached the angular velocity spiked very rapidly until it appears to level off at about 3 times the velocity at the risen position.
These are some very interesting findings which I will explore in further experiments.
Measurement Data and Links
The link to the original unedited test is shown here:
Angular Velocity Calculation
The angular velocity of the center of mass (COM) of the gyro, assuming the COM is the rotor, is derived as shown below. It is the distance the COM travels per time and can be calculated from the precession circle and the precession rate. Note though that in the Excel spreadsheet calculations I took an average of the precession rate and steepness angle for each interval.
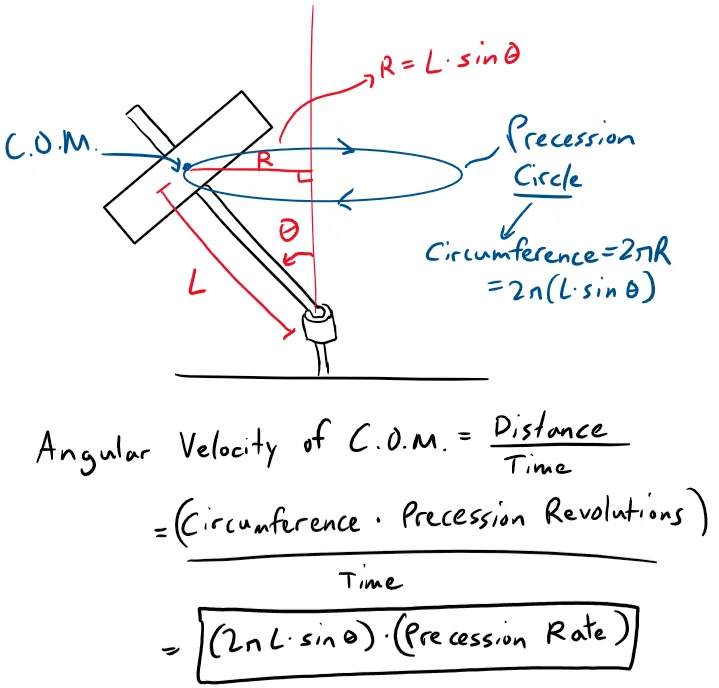
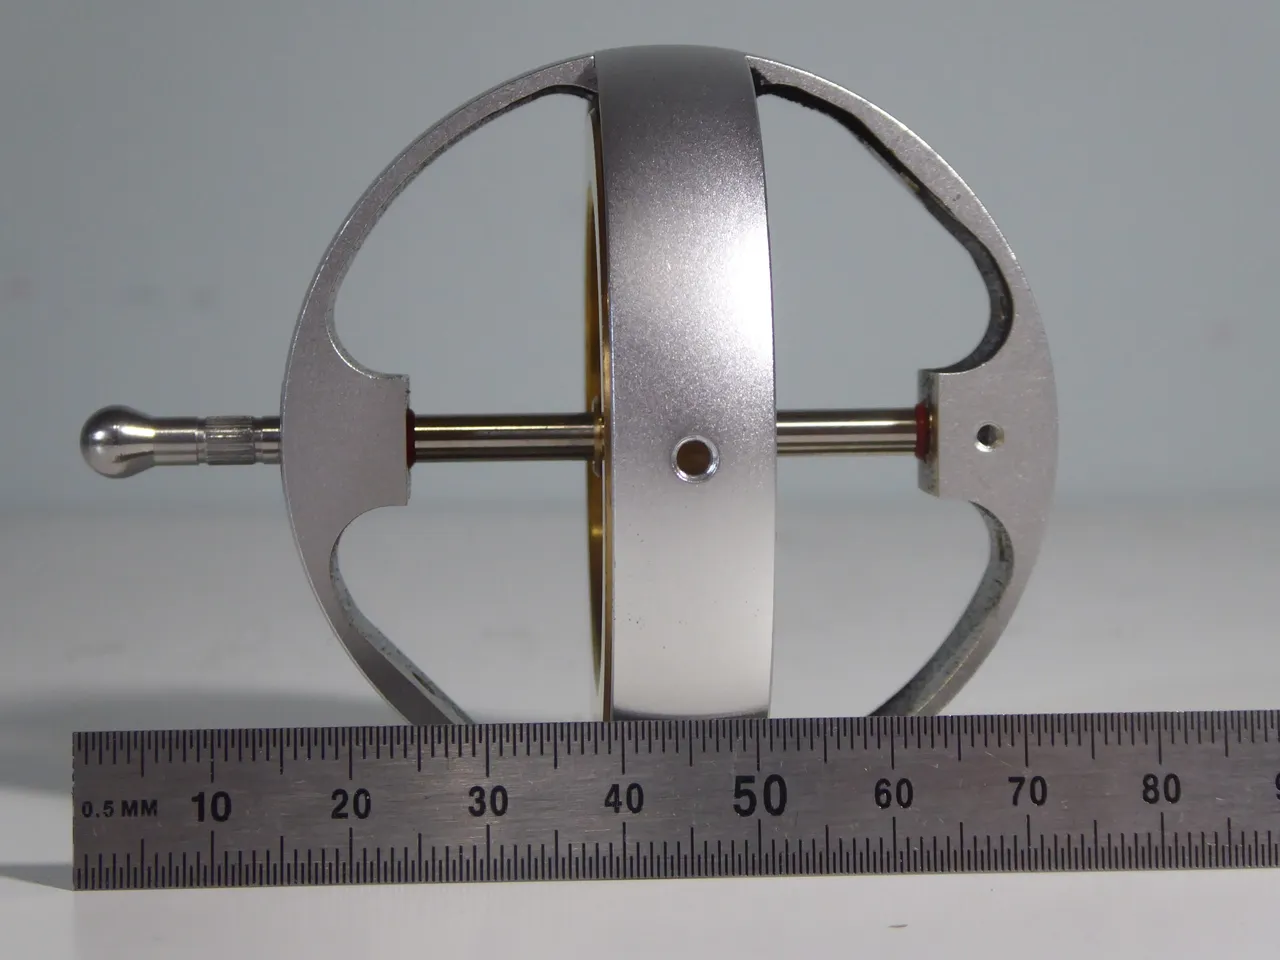
Note that the length from the stem to gyro rotor, hence the estimated center of mass (COM), is approximately 45 mm.
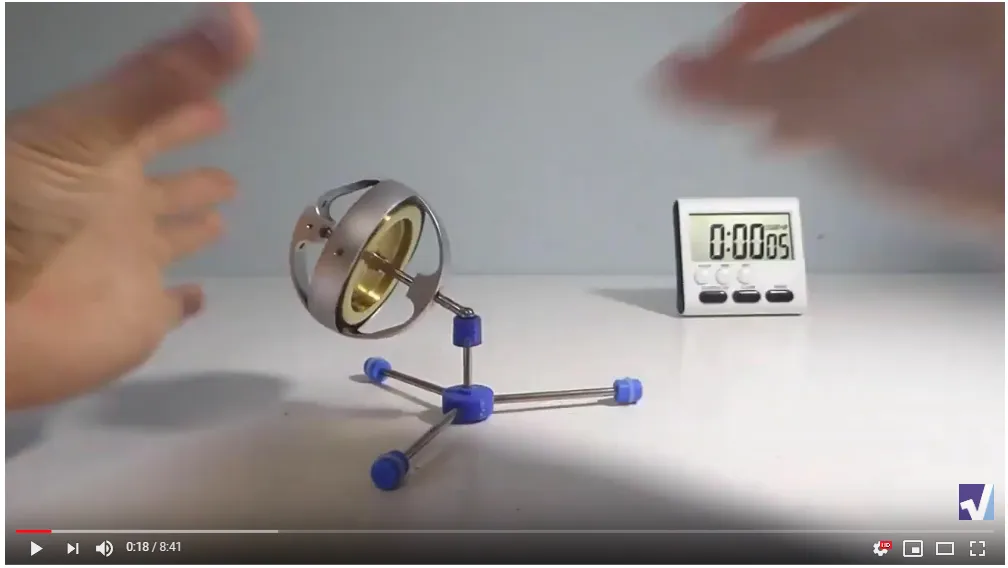
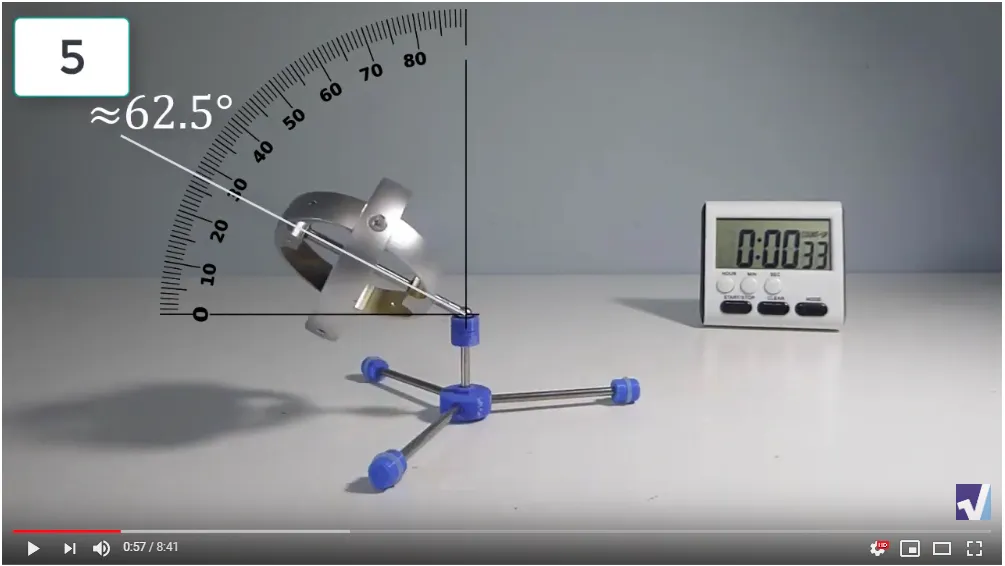
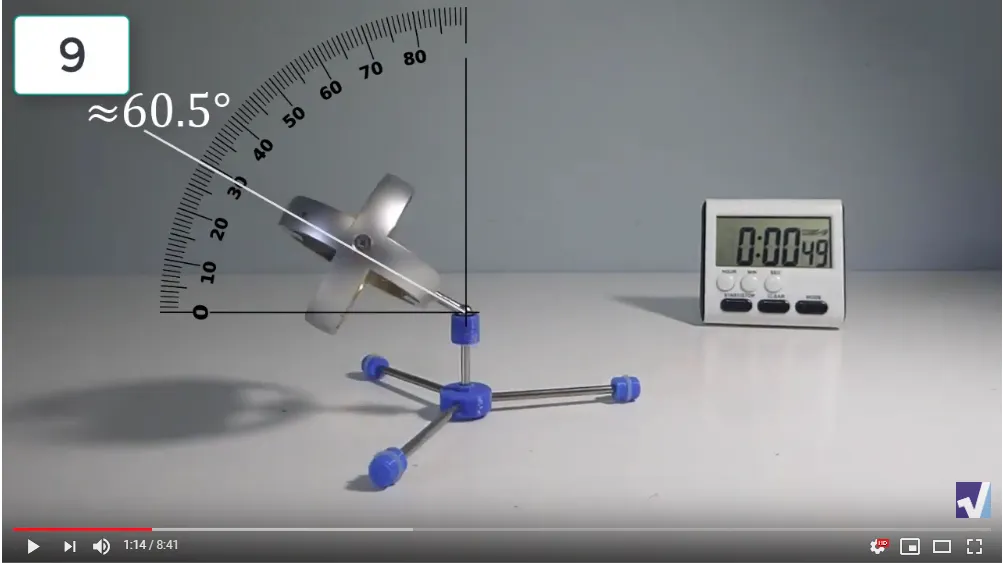
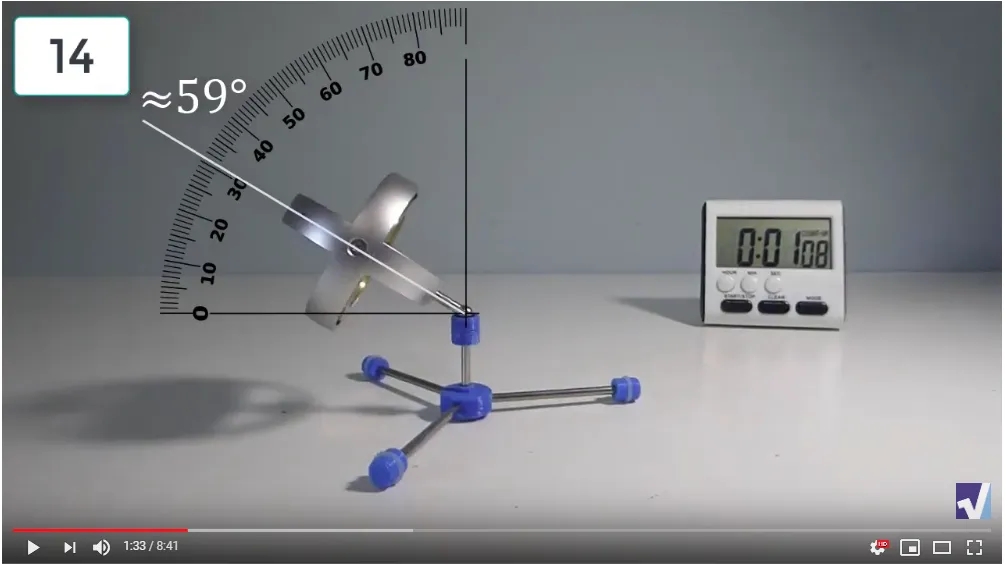
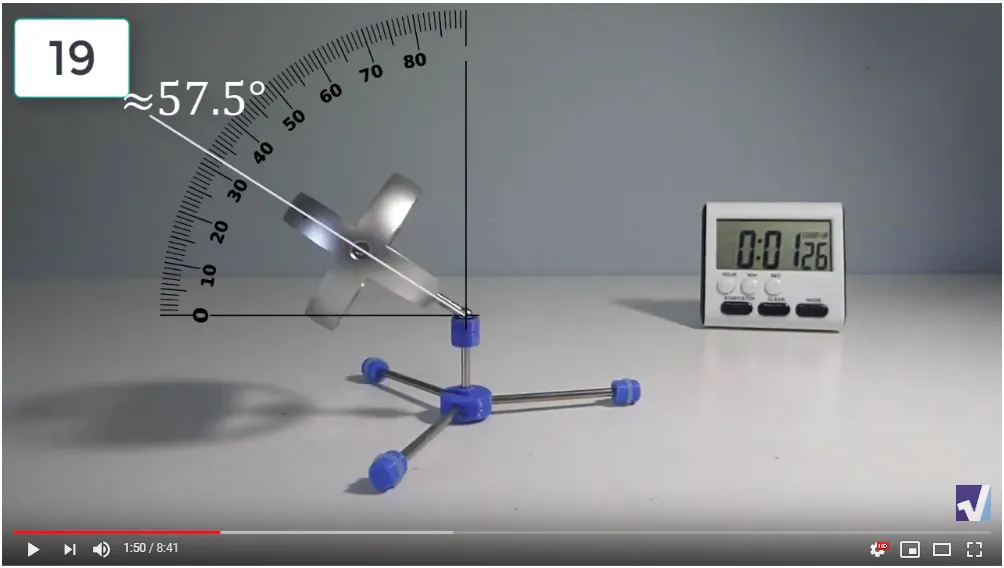
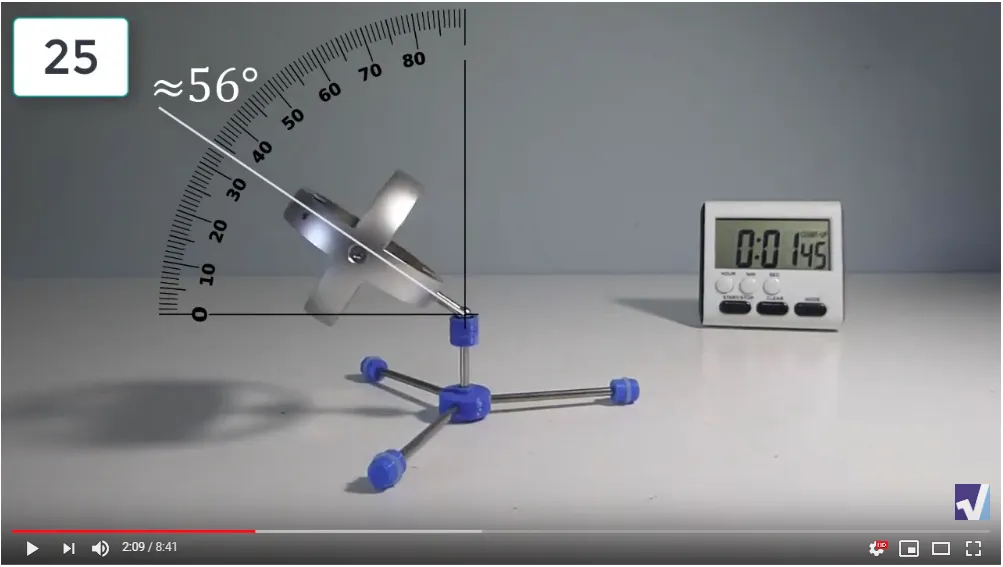
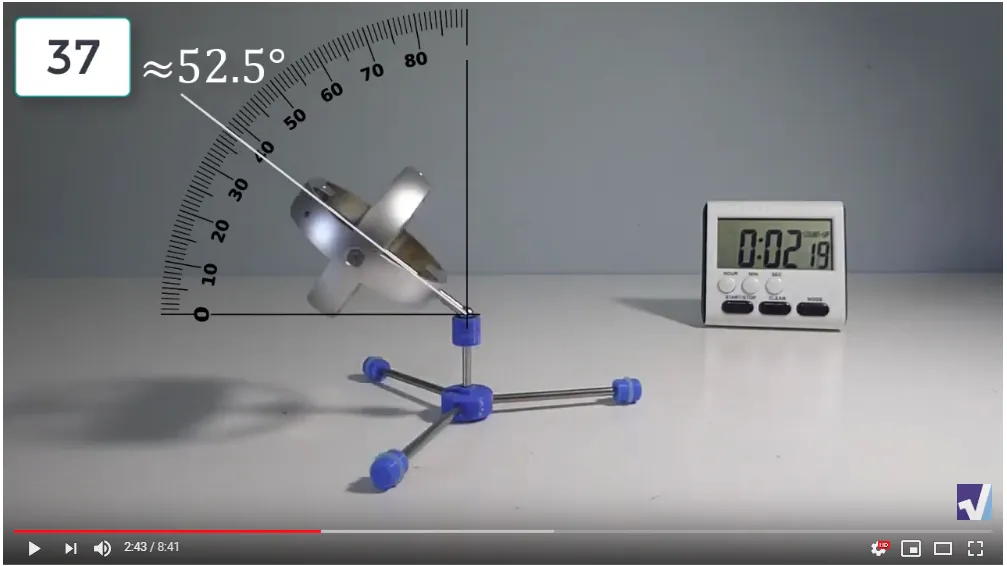
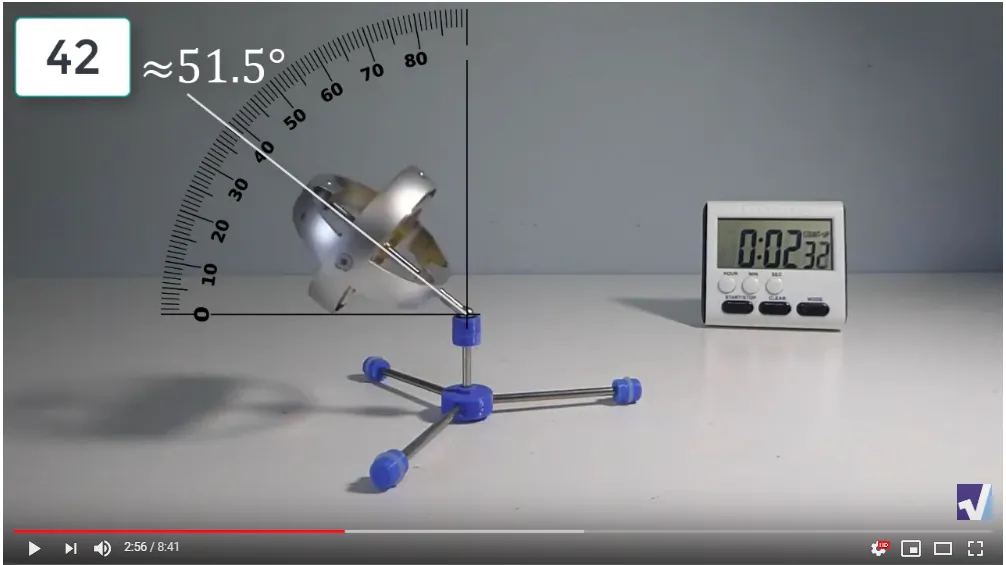
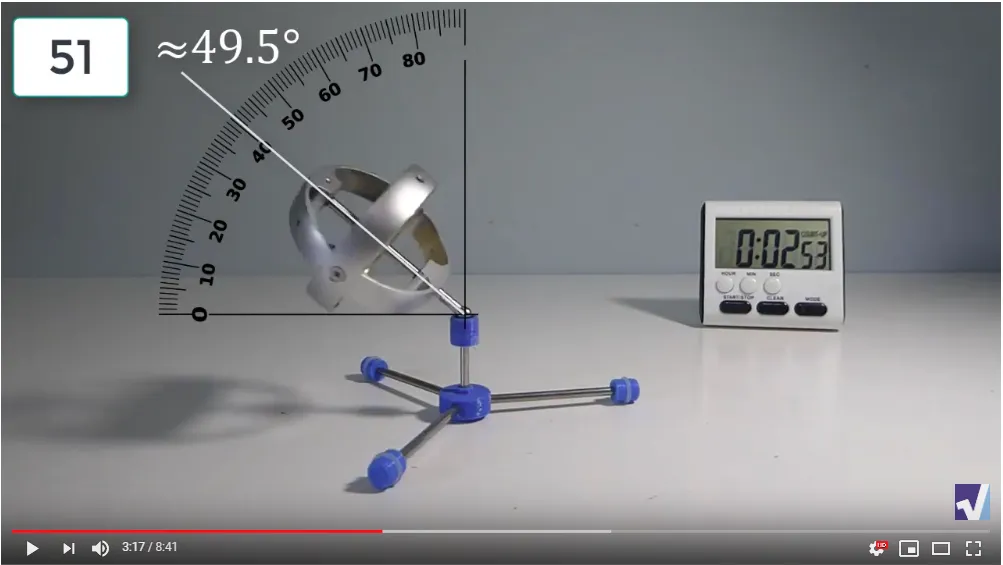
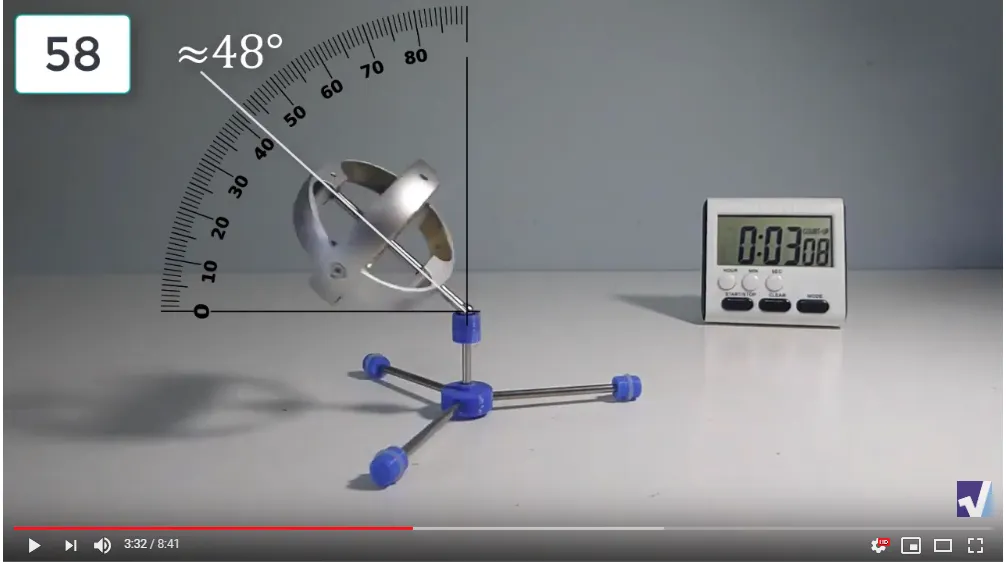
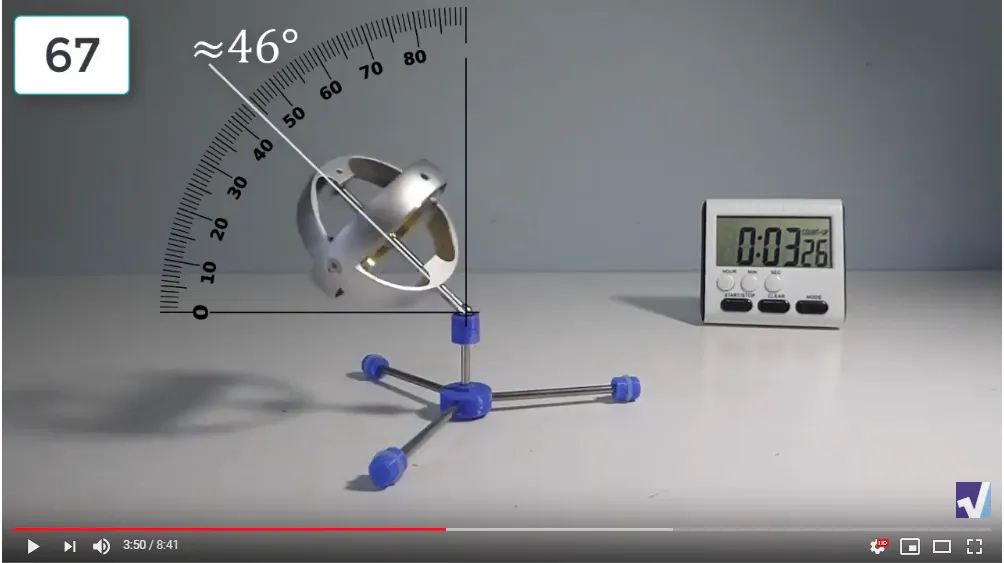
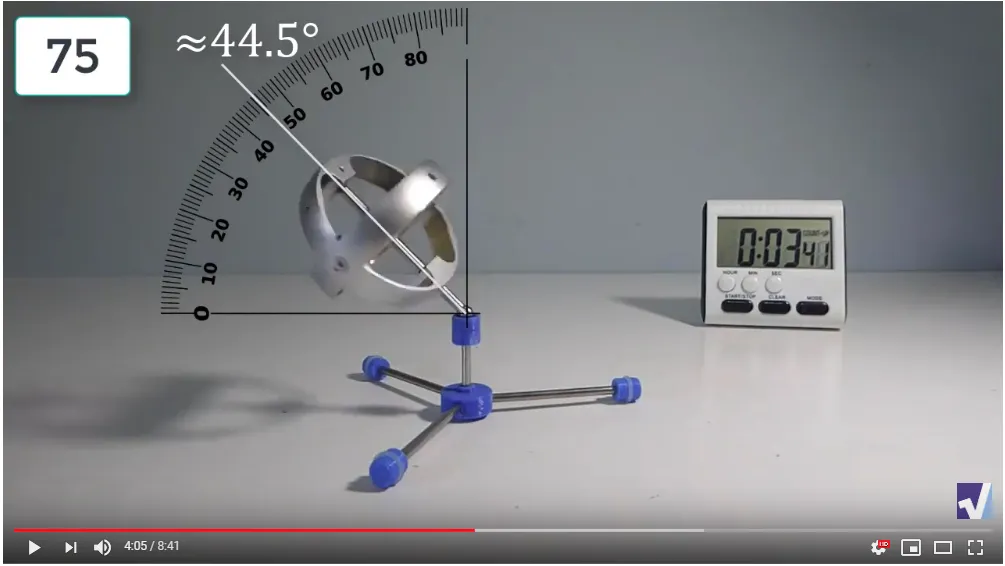
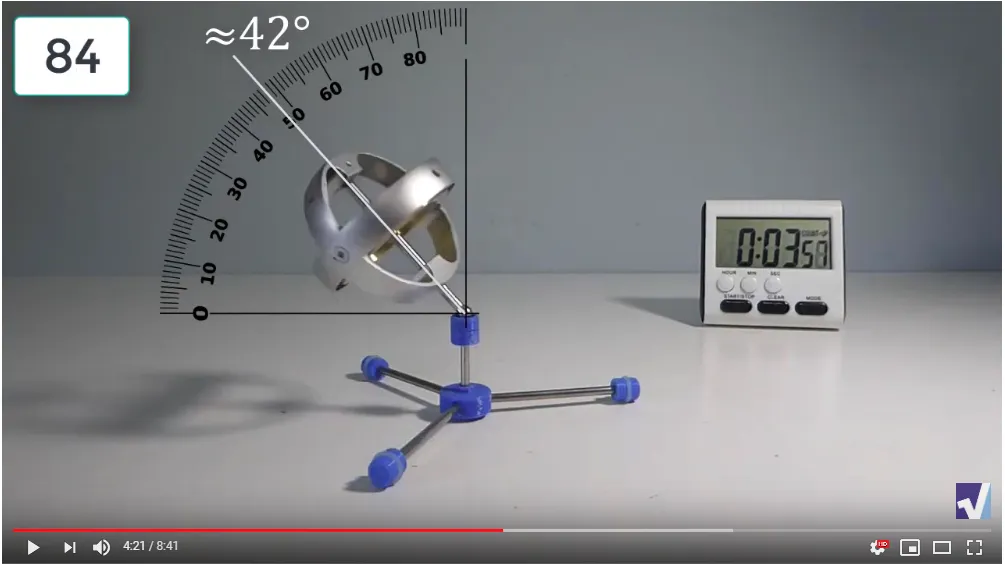
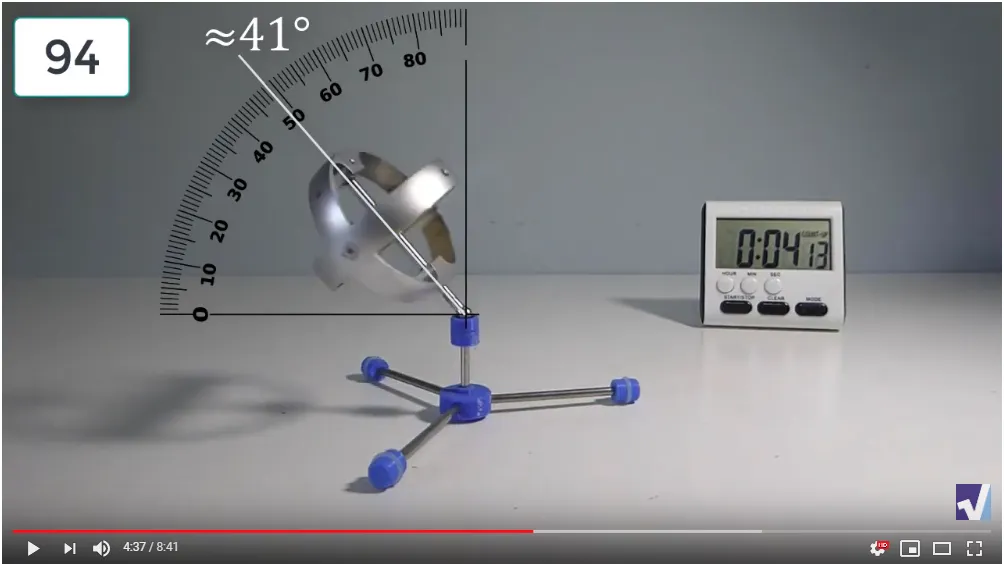
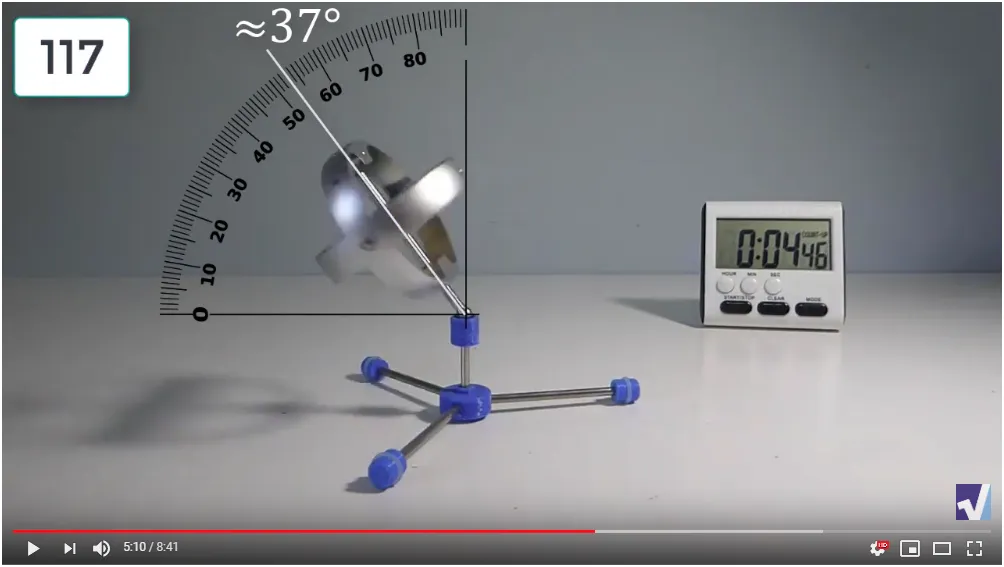
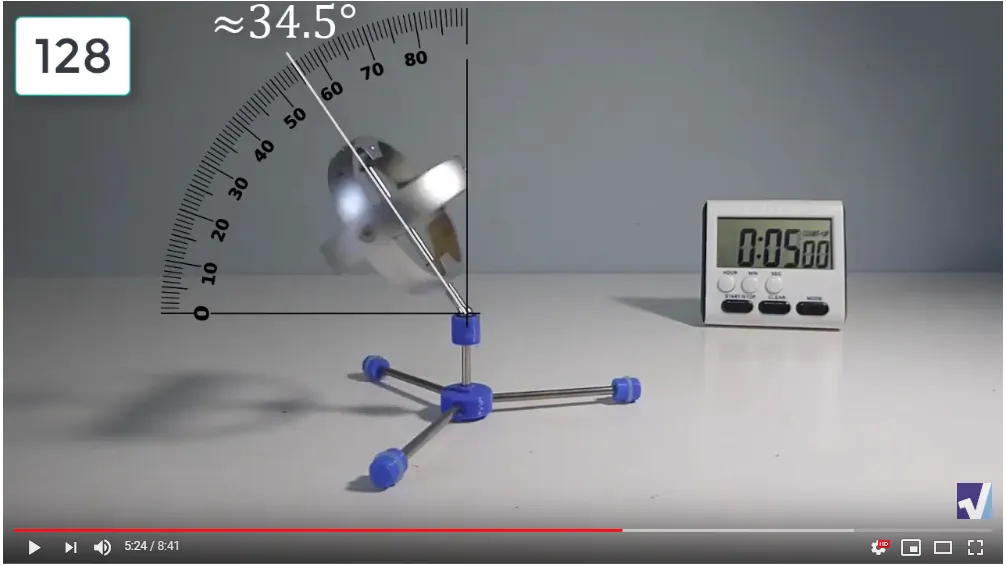
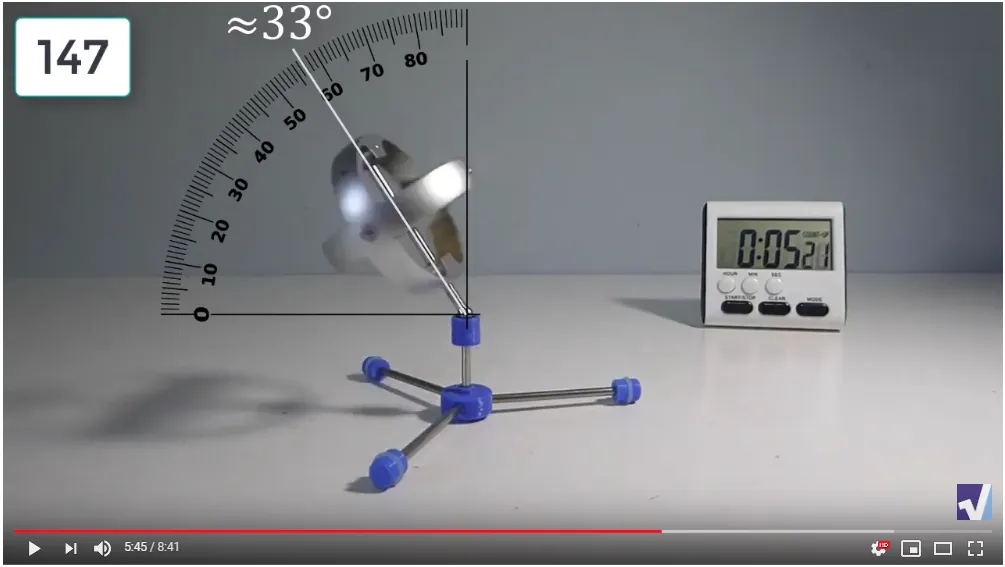
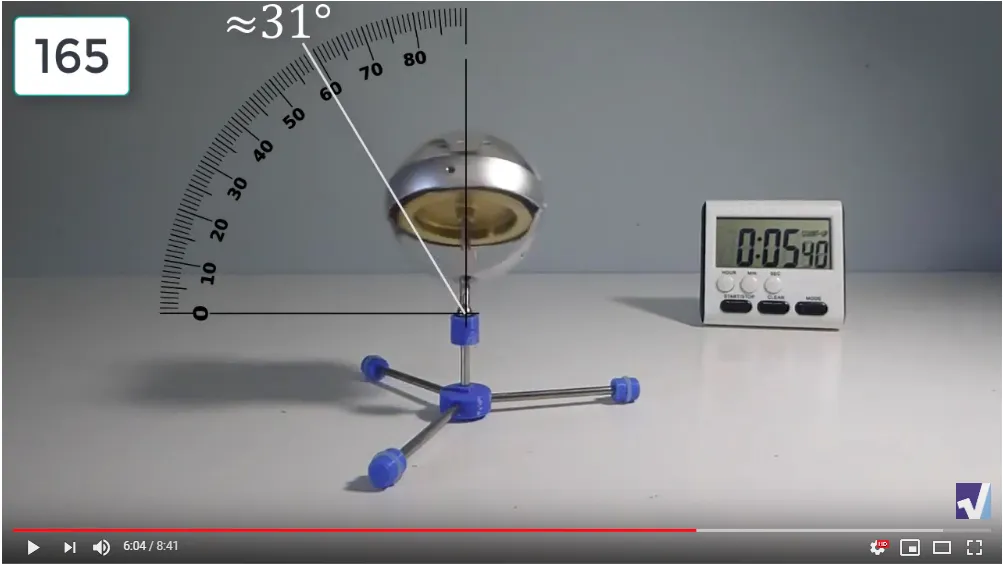
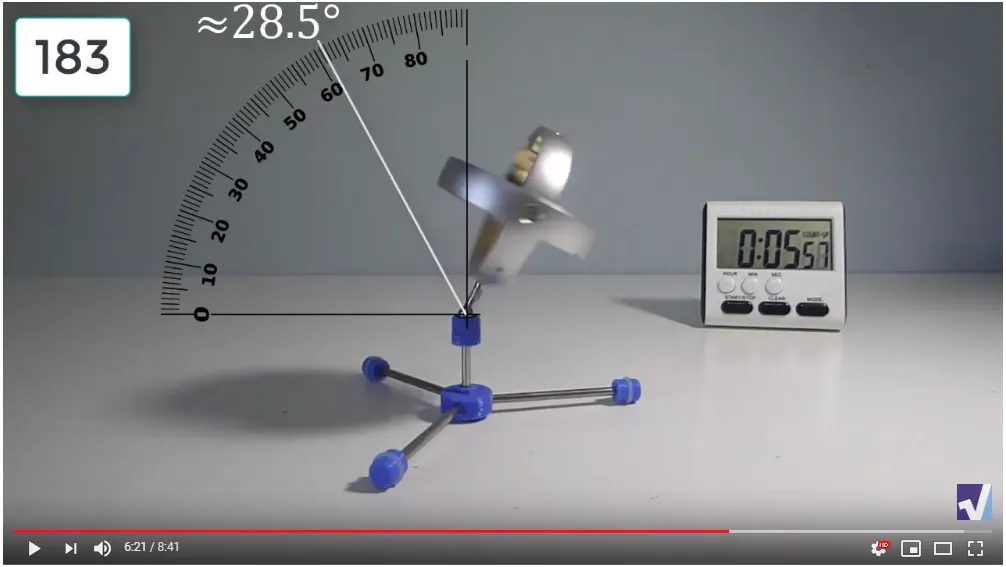
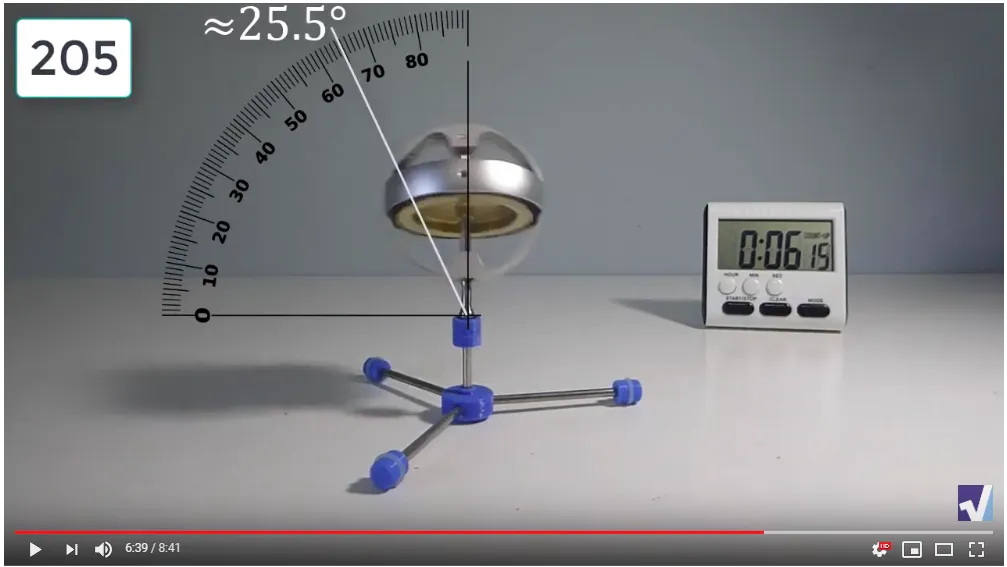
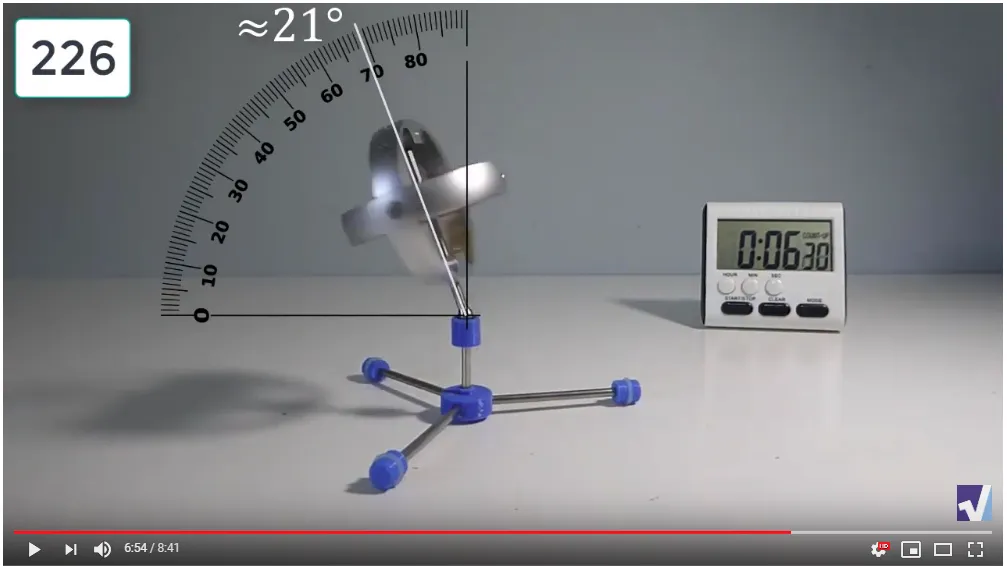
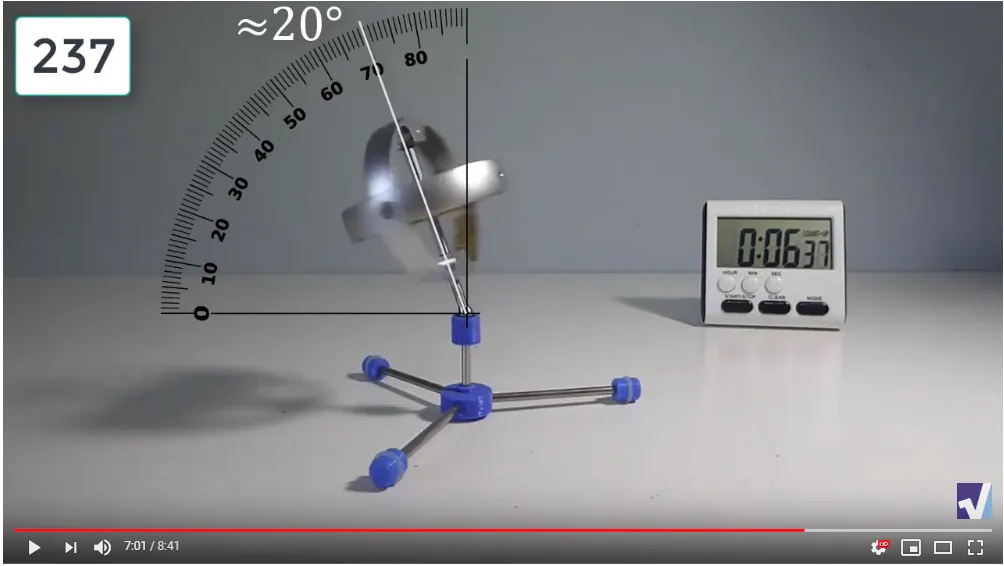
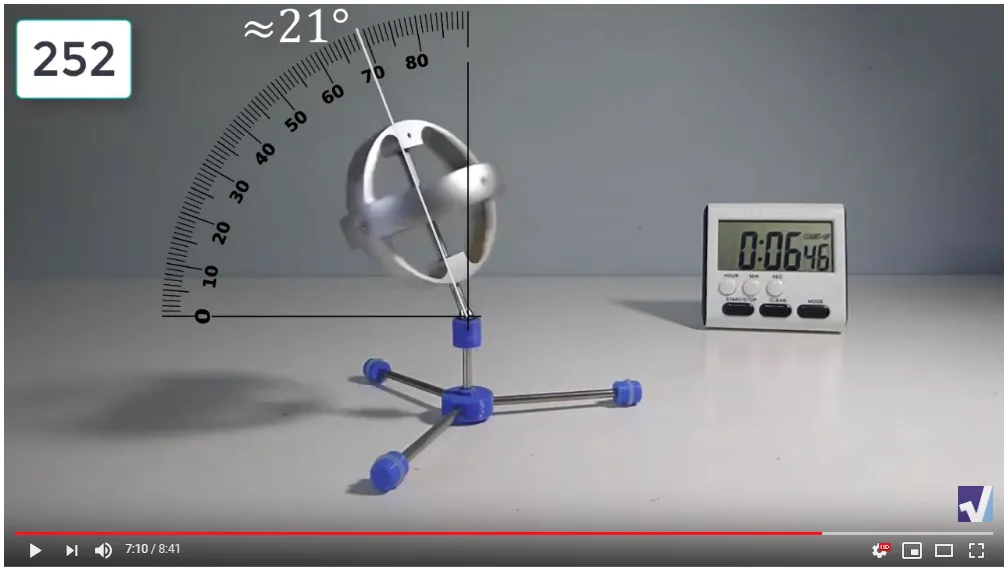
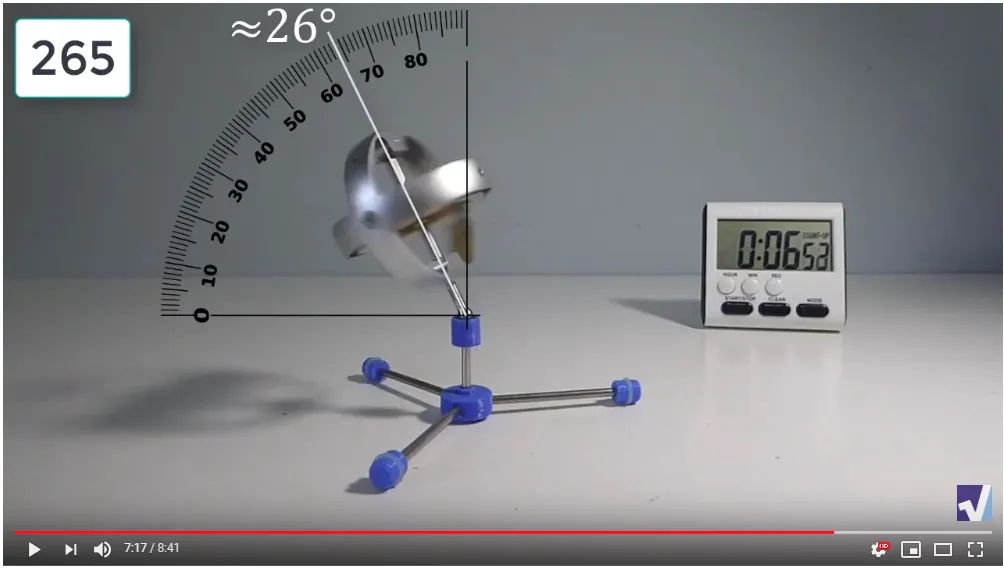
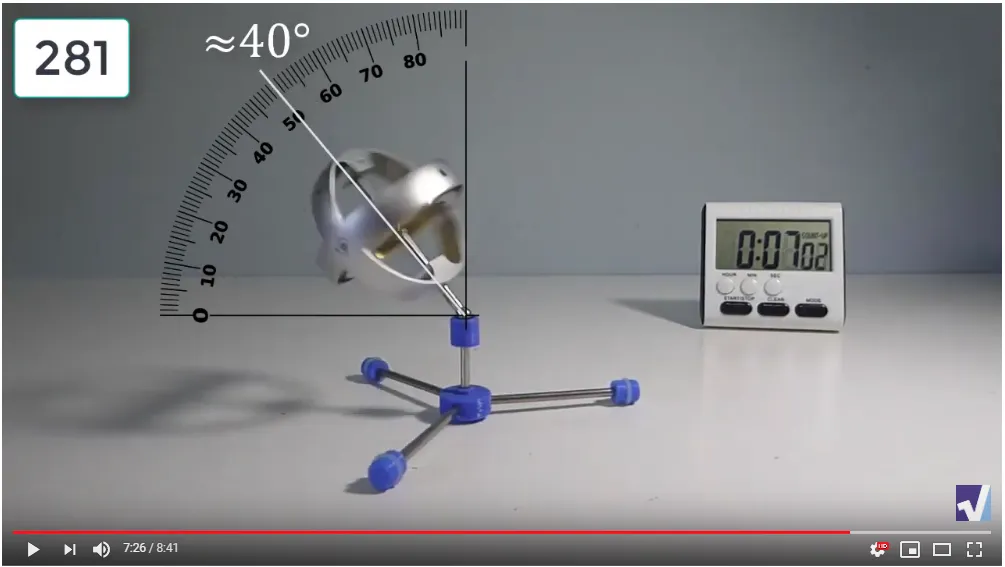
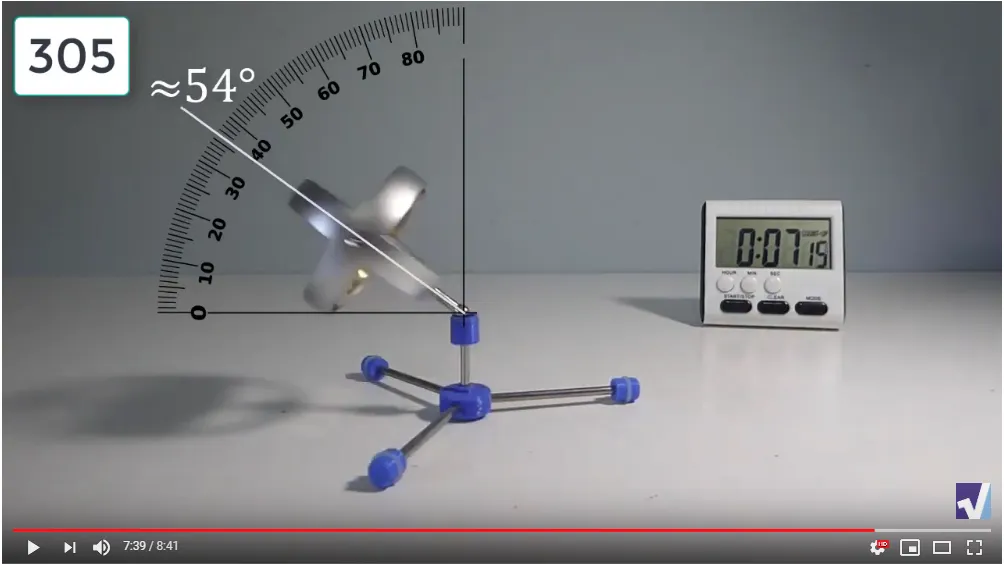
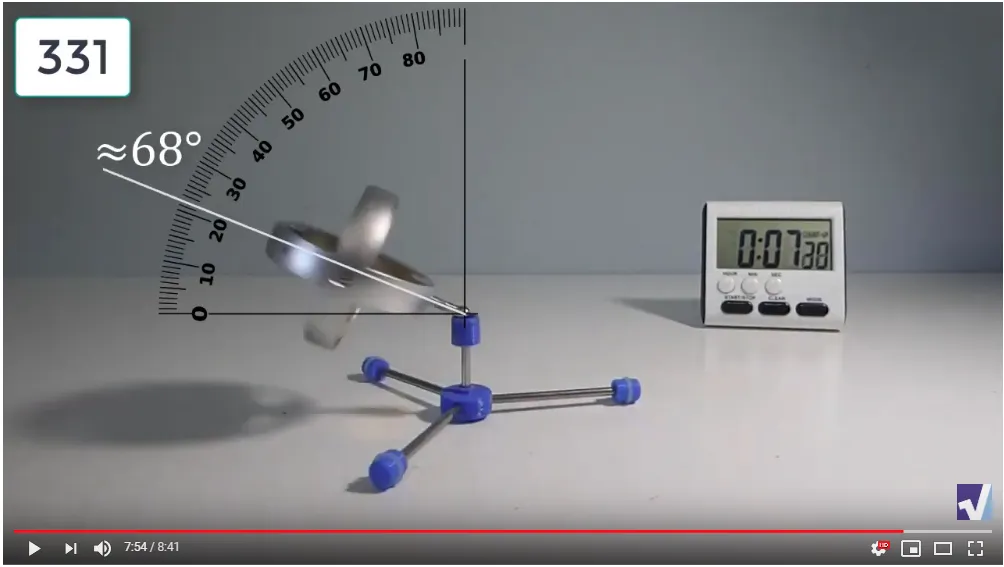
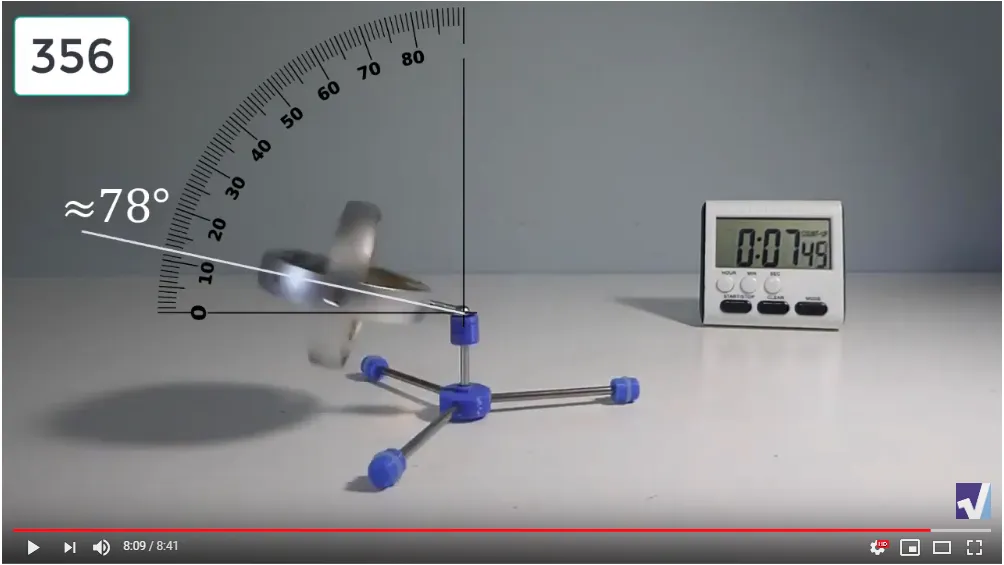
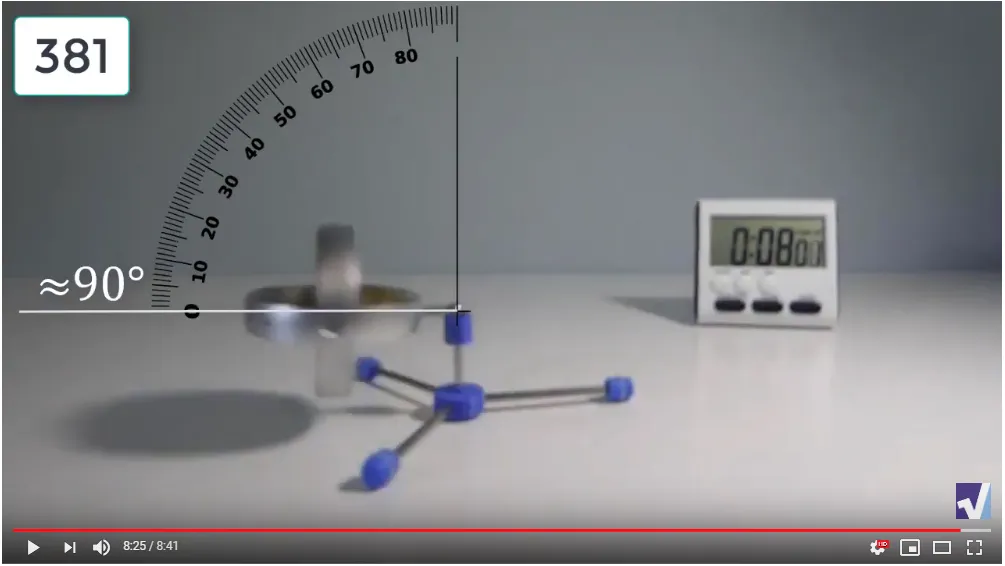
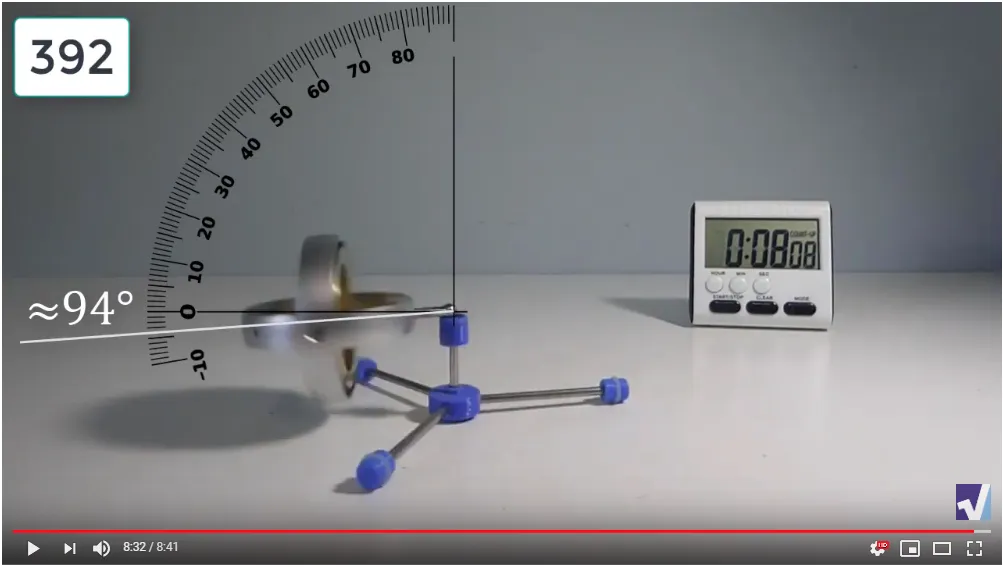
Screenshots of Each Time Interval
The data used in the spreadsheet is taken from the following screenshots at more or less every 15 seconds. The precession revolutions are counted from the initial angle measurement position.


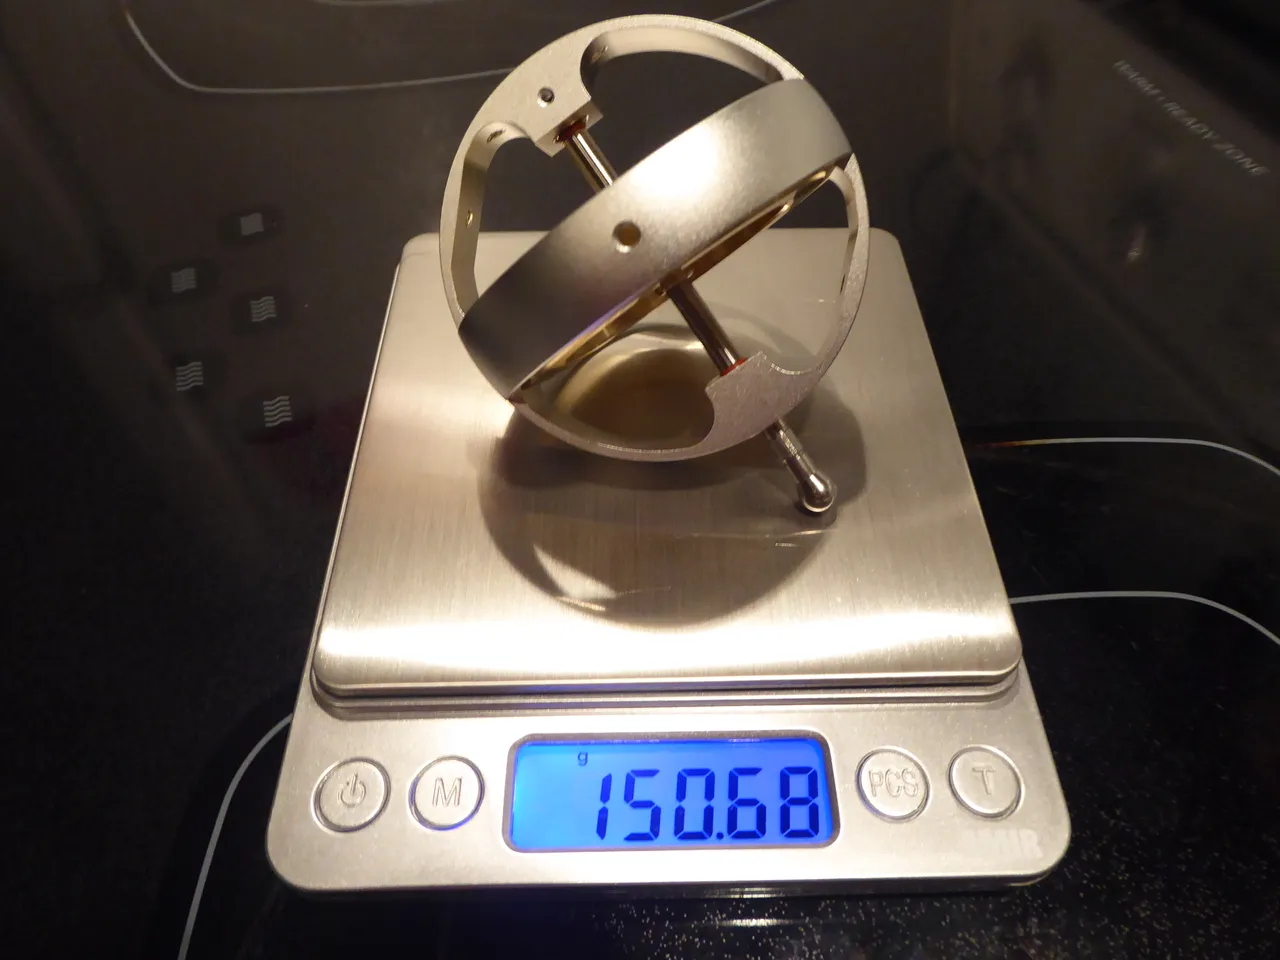
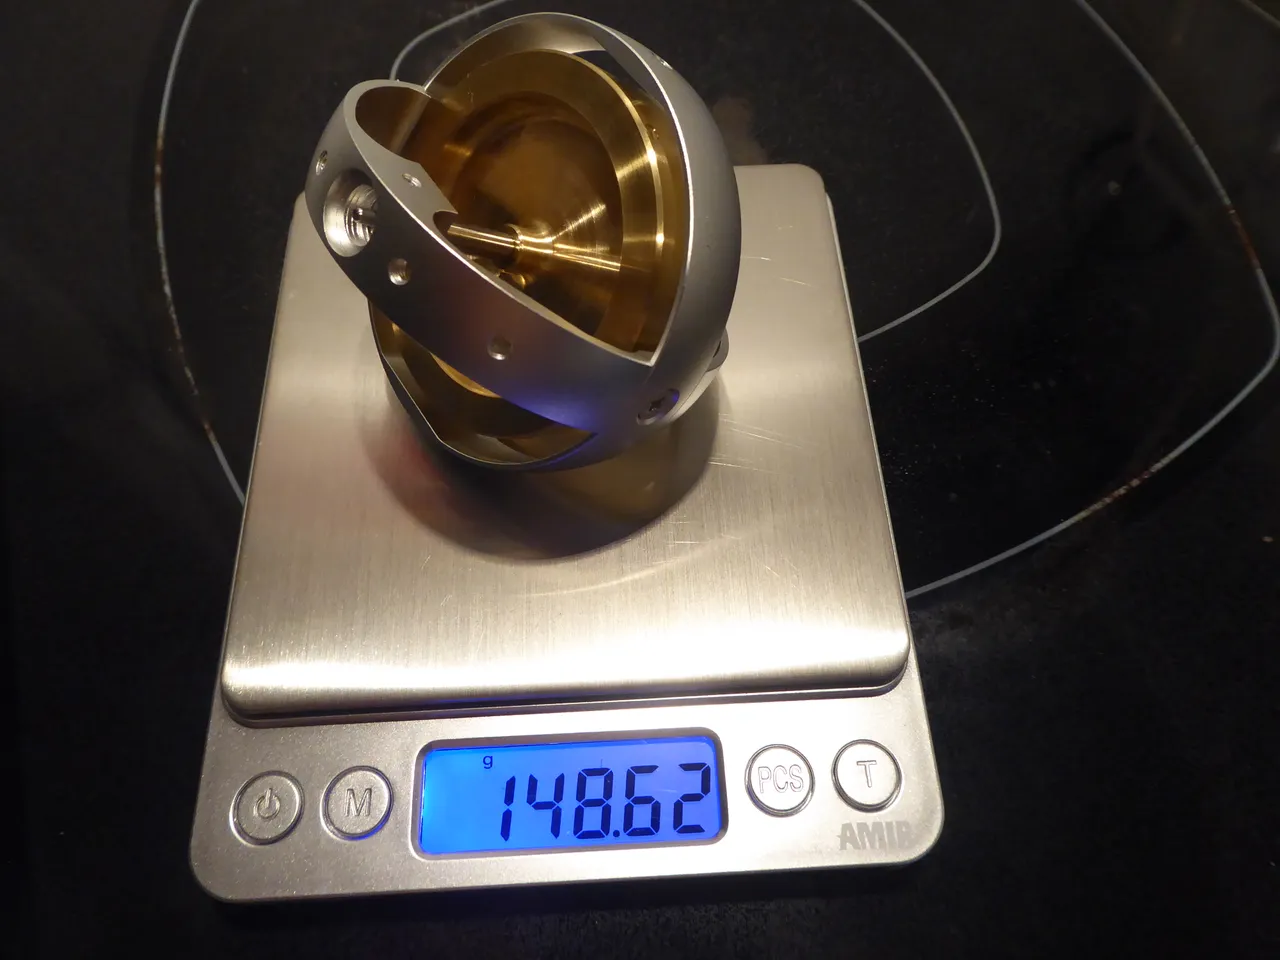
Gyro Weight Measurements
The weight of the gyroscope used in this experiment is 150.68 g with the stem, 148.62 g without the stem, and the stem is 150.68 – 148.62 = 2.06 grams.
Stay Tuned for #MESExperiments 16…
Watch Video On:
- 3Speak:
- Odysee: https://odysee.com/@mes:8/mesexperiments-15-gyroscopes-tend-to:e
- BitChute:
- Rumble: https://rumble.com/v1ybf42-mesexperiments-15-gyroscopes-tend-to-rise-until-precession-rate-has-peaked-.html
- DTube:
- YouTube:
View More Amazing Videos:
- #MESExperiments Video Series: @mes/list
- DRAFT #MESExperiments Video Series: https://mes.fm/experiments-draft
- #AntiGravity Video Series: @mes/series
- #FreeEnergy Video Series: https://mes.fm/freeenergy-playlist