
THIS POST WAS WRITTEN BOTH IN PORTUGUESE AND ENGLISH LANGUAGES. FOR THE ENGLISH VERSION, PLEASE KEEP SCROLLING DOWN THE PAGE!
PORTUGUESE VERSION:
Boa noite Steemians, tudo bem?
No post de hoje eu irei fazer uma análise técnica do preço do BTC, usando como base a ferramenta clássica das médias móveis exponenciais.
Para isso, eu divido essa análise em 4 partes, sendo que todas elas se referem ao curto prazo. Entretanto, apesar dos dados serem coletados no curto prazo eu entenderei a mesmas para o longo prazo, pois eu sou um HODLER e, portanto, variações de preço no curto prazo não fazem muito sentido para mim.
Para realizar essa análise, eu utilizei diversas visualizações do gráfico de velas da Binance, juntamente com as curvas das médias exponenciais de 7, 21, 30 e 180 dias. Dessa maneira eu tenho uma abrangência maior para poder fazer uma análise de maneira mais segura com uma série histórica maior.
Para quem não está familiarizado com as médias móveis exponenciais, elas são as médias de preços para um determinado período de tempo, sendo que o período mais recente tem maior peso na construção das curvas. Dessa maneira, além de prover uma visualização de uma tendência elas reagem mais rápido ao se levar em conta a volatilidade dos preços do mercado no curto prazo.
Média Móvel Exponencial de 7 dias (EMA 7): cor azul escuro
Média Móvel Exponencial de 21 dias (EMA 21): cor verde
Média Móvel Exponencial de 30 dias (EMA 30): cor amarelo
Média Móvel Exponencial de 180 dias (EMA 180): cor vermelho
Vamos lá!
- Velas de 15 minutos:
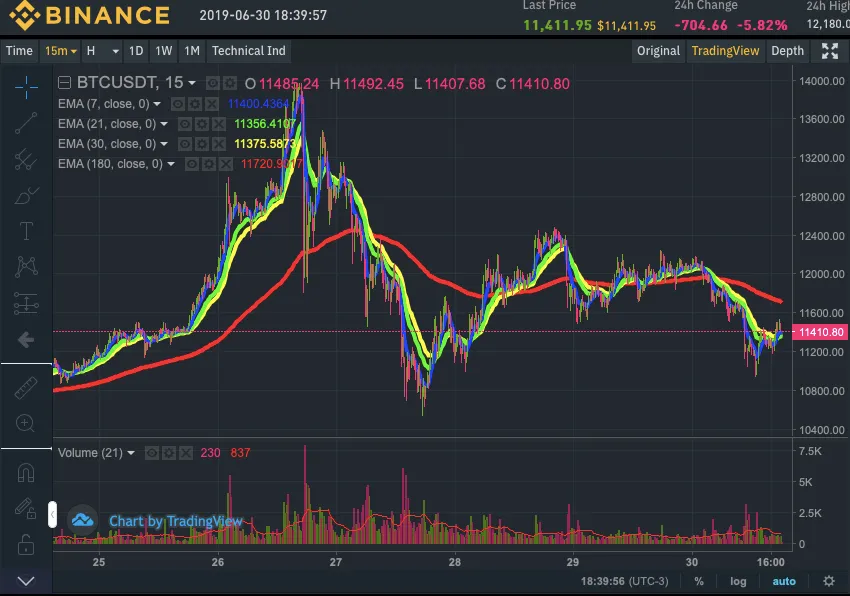
Fonte da Imagem: binance.com
Como poderão observar, nessa view de 15 minutos, podemos observar que a EMA 180 está acima das demais, mostrando que, no curto prazo, o mercado está em bear market. Isso não quer dizer que estejamos com uma tendência de queda do preço do BTC e sim que, na visualização das velas de 15 minutos estamos com uma aparente tendência de queda de preços. Digo aparente, pois ao observarmos as demais views, eu creio que ainda estejamos com uma tendência de bull market.
Para dizer que estamos nessa tendência de queda momentânea de preços, devemos observar o cruzamento das médias móveis, ou seja, quando a média móvel de curto prazo cruza a de longo prazo para cima temos, em teoria um bull market. Já quando ela cruza para baixo temos um bear. Se fossemos analisar esse gráfico isoladamente teríamos a percepção clara de um bear, pois além do cruzamento das EMAs temos também velas com topos e fundos cada vez menores, indicando, dessa forma, uma bear market e uma correção de preços.
Na linha de tendência de volume de operações (no quadrado inferior da tela), tem-se a impressão de um pequeno aumento do volume das operações (Volume (21)), depois de uma queda no volume das negociações que foram realizadas entre os dias 26 e 28 do mês.
- Velas de 30 minutos:
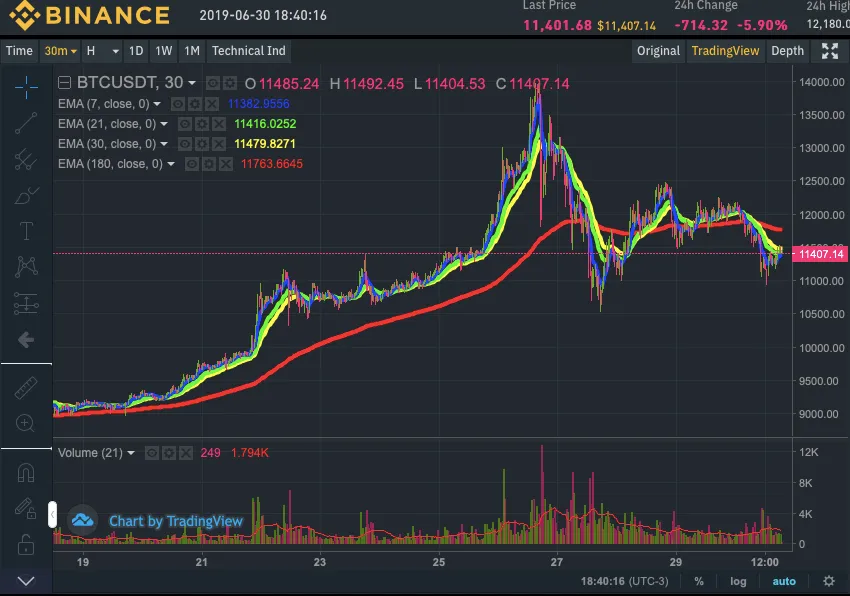
Fonte da Imagem: binance.com
Na view de 30 minutos também temos a mesma percepção de queda de preços segundo o que já foi explicado na view de 15 minutos.
Portanto um trader que faca short, deveria analisar melhor essas duas views, juntamente com outras ferramentas de análise técnica para que pudesse ter um melhor aproveitamento nas suas operações.
Já no quadro do volume de operações, podemos observar um pequeno aumento do volume das operações após o pico do mesmo entre os dias 26 e 28 (Volume (21))
- Velas de 1 dia
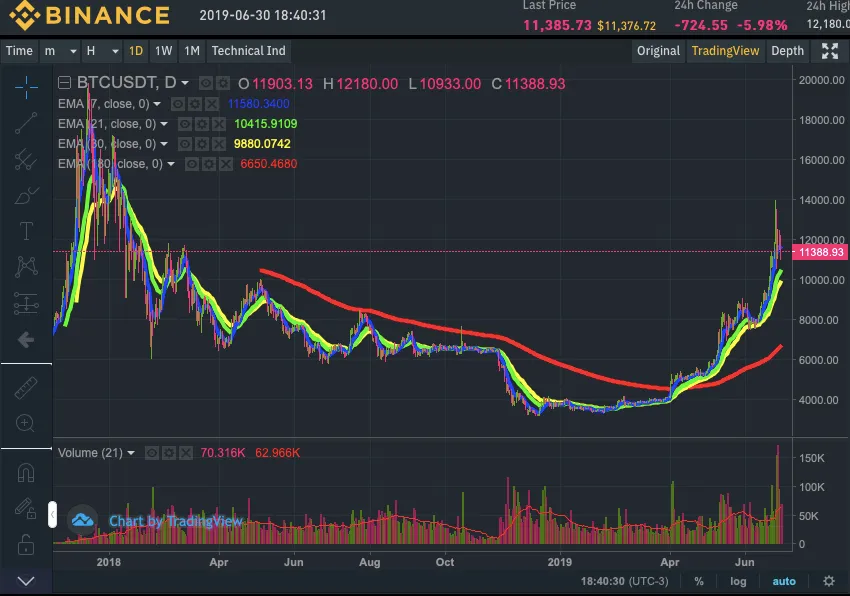
Fonte da Imagem: binance.com
Já na view de velas de 1 dia, temos a situação oposta das duas expostas acima. Como podem observar, as EMAs de curto prazo (7, 21 e 30) estão muito acima da EMA 180 (Média Móvel Exponencial de 6 meses). Além disso, observamos velas com topos e fundos sempre mais altos do que os anteriores, indicando assim uma clara tendência de alta (apesar da volatilidade e pequenas correções de preços nesse trajeto).
Adicionalmente, podemos observar que todas as curvas das EMAs estão apontando para cima, o que, em teoria, indica uma bull run market.
Cabe aqui uma consideração: no final dessa view, pode-se observar um grande pico nos preços, seguido por uma correção. Esse aumento de preços se deu entre os dias 26 e 29 de Junho, bem como a referida correção dos mesmos.
Em relação ao quadro do volume de operações, podemos observar que o volume negociado nessa ultima semana conseguiu se igualar ao volume que estava sendo negociado entre novembro e dezembro de 2018. Entretanto o preço é bem diferente!
- View de 1 semana
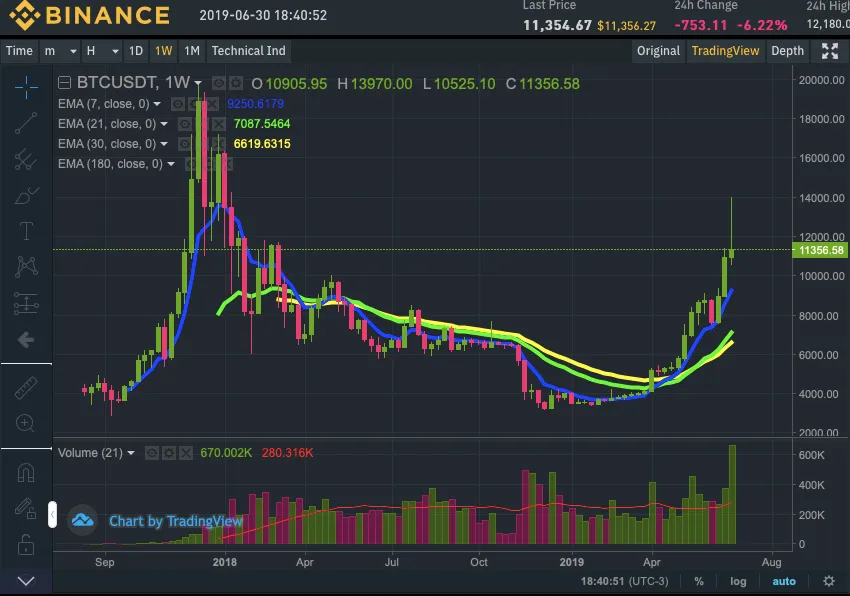
Fonte da Imagem: binance.com
Já na view de 1 semana, pode-se claramente observar a tendencia de alta, pois a EMA 7 e a EMA 21 estão muito acima da EMA 30 e principalmente da EMA 180.
Também em relação a todas essas curvas (e em especial a EMA 180), nota-se uma grande inclinação para cima, formando uma linda parábola. Adicionalmente os preços tem subido bastante ultimamente o que reforça a inclinação das mesmas.
Contudo o nível da curva da EMA 180 (linha de tendência de mais longo prazo) está ainda nos mesmos níveis do início do ano, mas com um preço do BTC muito acima do que era praticado nessa época.
Em relação ao volume de operações, o volume se encontra num bom nível onde, creio eu, seja suficiente para sustentar essa tendência de bull market.
Novamente eu digo... eu, como sou um HODLER, olho ambas as views (curto, médio e longo prazo), mas como não sou um trader, eu tendo a tomar a minha decisão com base nos dois últimos gráficos (de 1 dia e 1 semana). Isso me da uma certa margem de segurança para poder sair do mercado antes que ele tenha um grande crash. Para se ter uma idéia, desde a minha última entrada (última compra de BTC), só com a variação de preços eu obtive um ganho de mais de 50% (isso sem contar na quantidade de moedas que eu estou tendo, que também está tendo um aumento nominal).
Portanto para mim eu ainda me encontro em uma posição favorável, uma vez que as oscilações de curtíssimo prazo não afetam a tendência de médio e longo prazo.
Adicionalmente as notícias do mercado de criptomoedas tem, de certa maneira sido benéficas e voltado a colocar as criptas em evidencia.
Você gostou desse conteúdo? Por favor me ajude a manter posts com qualidade e regularidade, doando qualquer quantia em BTC, ETH ou Doge para uma das carteiras abaixo.
BTC wallet

ETH wallet

DOGE wallet:

STEEM wallet: @aotearoa
SBD wallet: @aotearoa
Juntos nós podemos fazer com que o #Steemit cresça ainda mais forte e mais rápido!
Posts Recentes:
9 Reasons Why Intelligent People Have Fewer Friends
As vacinas realmente protegem as pessoas? (Do vaccines really protect people?)

ptgram power: | faça parte | grupos | projetos | membros |
| ptg shares | trilha premium | fórum externo | fórum na blockchain | siga: | @brazine | @brazilians | @camoes | @coiotes | @dailycharity | @imagemvirtual | @msp-brasil | @ptgram-power | @unitedpeople |

ENGLISH VERSION:
Good evening Steemians, how do you do?
In today's post I will do a technical analysis of the price of the BTC, using as base the classic tool of exponential moving averages.
For this, I divide this analysis into 4 parts, all of which refer to the short term. However, although the data is collected in the short term I will understand the same for the long term, as I am a HODLER and therefore, price variations in the short term do not make much sense to me.
To perform this analysis, I used several views of the Binance candle chart along with the exponential averages of 7, 21, 30, and 180 days. In this way I have a greater scope to be able to make an analysis more safely with a larger historical series.
For those who are unfamiliar with exponential moving averages, they are the price averages for a given period of time, with the most recent period having greater weight in the construction of the curves. Thus, in addition to providing a view of a trend, they react faster by taking market price volatility into account in the short run.
Exponential Mobile Average of 7 days (EMA 7): dark blue color
Exponential Mobile Average of 21 days (EMA 21): green color
30-Day Exponential Moving Average (EMA 30): yellow color
180 Day Exponential Mobile Average (EMA 180): red color
Come on!
- 15-minute candles:
Image Source: binance.com
As you can see, in this 15 minute view, we can see that the EMA 180 is above the others, showing that, in the short term, the market is in the bear market. This is not to say that we are experiencing a downward trend in the price of BTC, but rather that in the 15-minute candle display we are experiencing an apparent downward trend in prices. I say apparent, because when looking at the other views, I believe we are still with a bull market trend.
To say that we are in this momentary trend of prices, we must observe the crossing of moving averages, that is, when the short-term moving average crosses the long-term upwards we have, in theory, a bull market. Already when she crosses down we have a bear. If we were to analyze this graph in isolation we would have the clear perception of a bear, since besides the crosses of EMAs we also have sails with increasingly smaller tops and bottoms, indicating, in this way, a bear market and a price correction.
In the trend line of operations volume (in the bottom square of the screen), there is a slight increase in the volume of operations (Volume (21)), after a decrease in the volume of the negotiations that took place between the days 26 and 28 of the month.
- 30-minute candles:
Image Source: binance.com
In the 30-minute view we also have the same perception of falling prices as explained in the 15-minute view.
Therefore, a trader who shorts should better analyze these two views, along with other technical analysis tools so that he can better exploit his operations.
In the volume of operations, we can observe a small increase in the volume of operations after the peak of the operation between days 26 and 28 (Volume (21))
- 1 Day Candles
Image Source: binance.com
Already in the view of 1 day candles, we have the opposite situation of the two exposed above. As you can see, the short-term EMAs (7, 21 and 30) are well above the EMA 180 (Exponential Mobile Average of 6 months). In addition, we observed sails with tops and bottoms always higher than the previous ones, thus indicating a clear upward trend (despite the volatility and small price corrections in this route).
Additionally, we can observe that all the curves of the EMAs are pointing up, which, in theory, indicates a bull run market.
Here is a consideration: at the end of this view, you can see a large spike in prices, followed by a correction. This increase in prices took place between the 26th and 29th of June, as well as the aforementioned correction.
Regarding the volume of operations, we can see that the volume traded in the last week was able to match the volume that was being traded between November and December 2018. However the price is quite different!
- 1 Week View
Image Source: binance.com
In the 1-week view, the discharge trend can clearly be observed, since the EMA 7 and the EMA 21 are well above the EMA 30 and especially the EMA 180.
Also in relation to all these curves (and in particular the EMA 180), a great upward inclination is made, forming a beautiful parabola. In addition, prices have been increasing a lot lately, which reinforces their inclination.
However, the curve level of the EMA 180 (longer-term trend line) is still at the same levels as at the beginning of the year, but with a BTC price well above what was practiced at that time.
In terms of volume of operations, the volume is at a good level where, I believe, it is sufficient to sustain this bull market trend.
Again I say ... I, as I am a HODLER, I look at both views (short, medium and long term) but as I am not a trader, I tend to make my decision based on the last two charts (1 day and 1 week). This gives me a certain margin of safety to be able to exit the market before it has a major crash. To get an idea, since my last entry (last purchase of BTC), only with the price variation did I get a gain of more than 50% (this without counting the amount of coins that I am having, which is also having a nominal increase).
So for me I still find myself in a favorable position, since very short-term oscillations do not affect the medium- and long-term trend.
Additionally, the news of the cryptomoedas market has, in a way, been beneficial and aimed at putting the crypts in evidence.
Did you like this content? Please help me keep posts with quality and regularity by upvoting this post or donating any amount in BTC, ETH or Doge to one of the portfolios below.
BTC wallet
ETH wallet
DOGE wallet:
STEEM wallet: @aotearoa
SBD wallet: @aotearoa
Together we can make #Steemit grow even stronger and faster!
Recent Posts:
9 Reasons Why Intelligent People Have Fewer Friends
As vacinas realmente protegem as pessoas? (Do vaccines really protect people?)
ptgram power: | faça parte | grupos | projetos | membros |
| ptg shares | trilha premium | fórum externo | fórum na blockchain | siga: | @brazine | @brazilians | @camoes | @coiotes | @dailycharity | @imagemvirtual | @msp-brasil | @ptgram-power | @unitedpeople |