
Nice find. So that (after I zoomed in on the charts by right-clicking and editing the urls) indicates $3 – 5k for remainder of 2019, possibly with a spike to $6k. The range for 2020 is $5 – 10k. And new ATHs in 2021 with a blowoff peak in late 2022 of $86k.
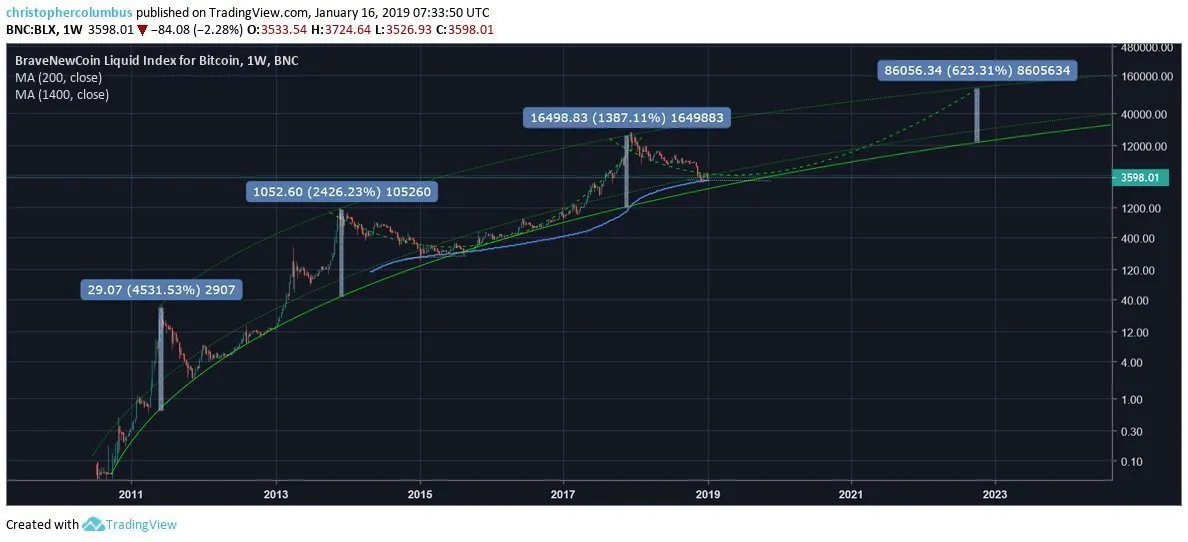
It’s going to be challenging for me to manage expenses for 2019, but I should be able to squeeze through. 2020 will provide a lot of momentum and need to be prepared to accelerate rapidly on all fronts. 2021 and 2022 will be another crazy frenzy. I will be age 57 in 2022. Other than my health issue, this is not too old. I am poised and laying the groundwork now.
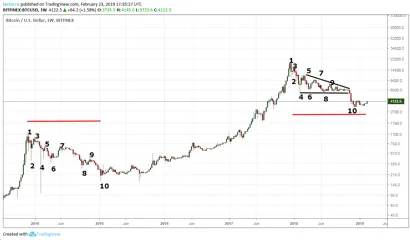
Here is something very important. Armstrong wrote on November 26:
A year-end closing below 4150 will point to a drop back to 775 area.
Note that Bitcoin closed the year at $4177! So Armstrong’s most bearish possible scenario was miraculously averted.
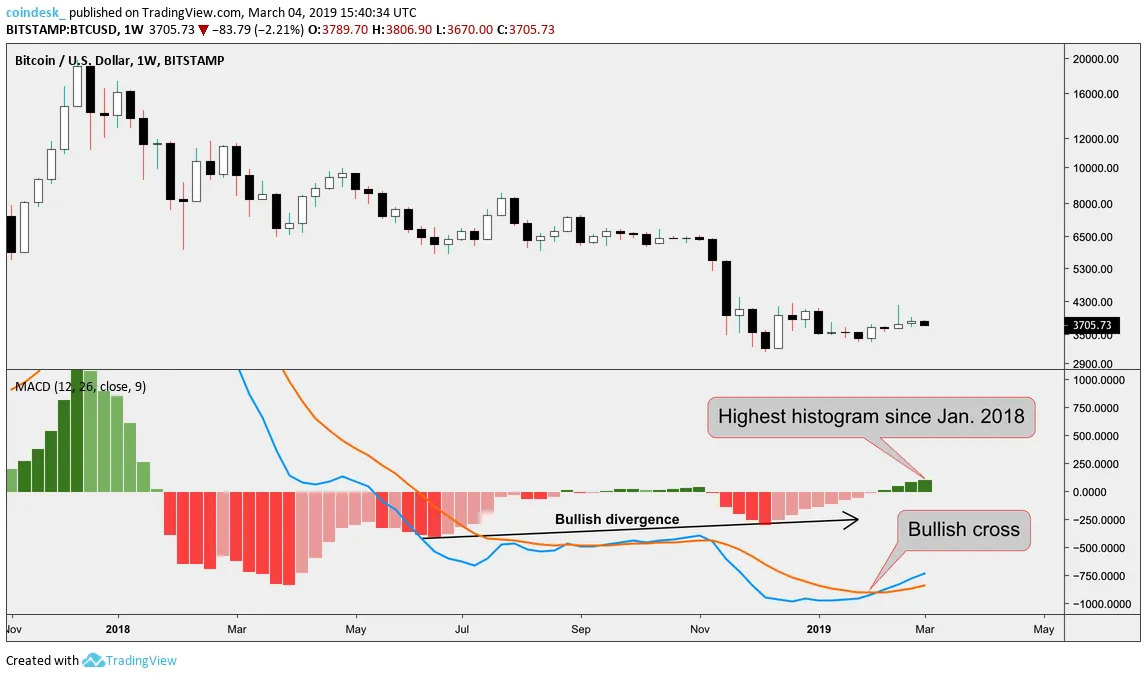
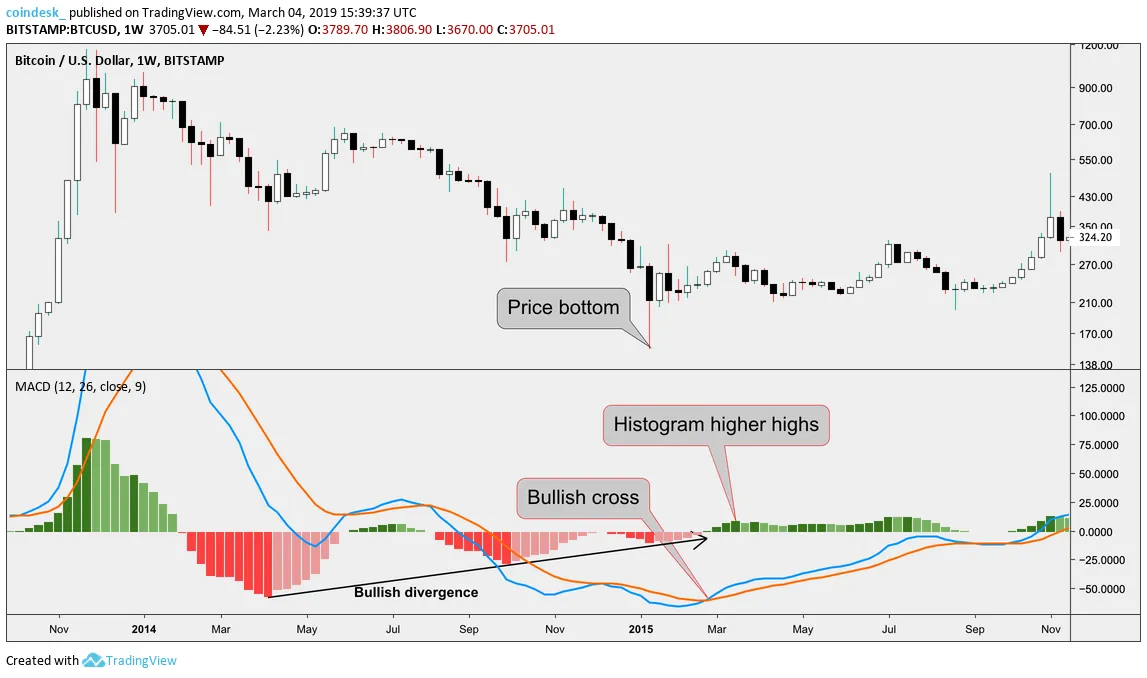
EDIT: Another corroborating chart:
EDIT#2: Bitcoin price is unlikely to drop below $3400 ever again, and possibly not below $3600:
EDIT#3: There’s a threat of Bitcoin dropping back to $3700 and even much lower, although something seems off with that NVT Signal chart compared to its historical pattern.
On the positive side, there’s another more detailed logistic (log-normal) projection for extrapolating the Bitcoin price into the future and it predicts a $50,000 “clean price” in 2022 and ~$1 million price within roughly a decade.
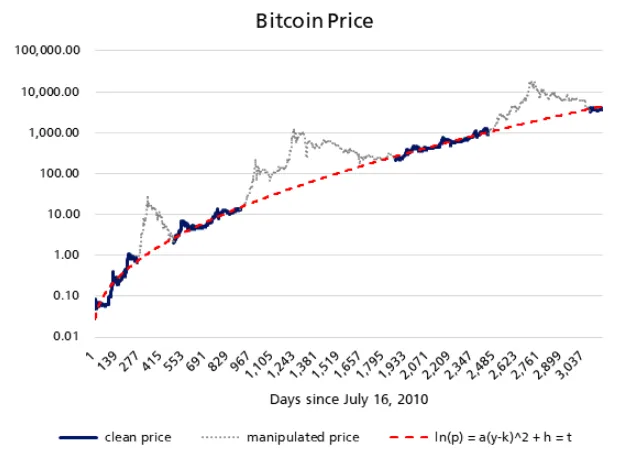
Note the $50k in 2022 is not the “manipulated price” which could be multiples higher. Tim Draper is expecting a $230,000 peak by 2023.
RE: Most Important Bitcoin Chart Ever