

As the project is one of the projects that I like, despite only having a few hundred ALIVE, I decided to create a weekly report where we can follow the evolution of the token's tokenomics.
Why weekly and not daily?
Because I think a daily post about this, it will be like spam.
ALIVE
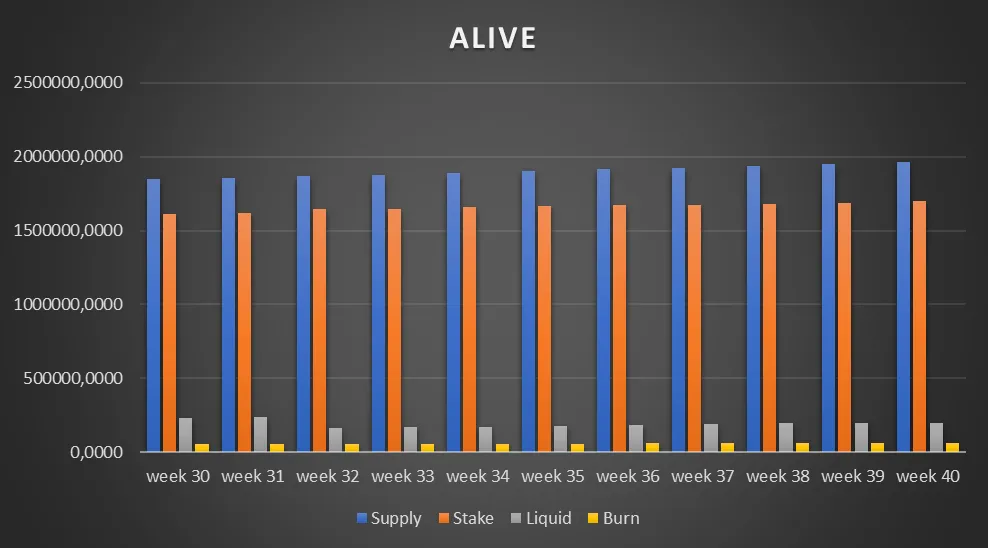
| Supply | Stake | Liquid | Burn | Holders | |
|---|---|---|---|---|---|
| week 30 | 1848004,4914 | 1614706,1375002 | 233298.3539 | 56526,7498 | 6731 |
| week 31 | 1854532,4183 | 1615640,8979002 | 238891.5204 | 56871.7498 | 6746 |
| week 32 | 1867973,2106 | 1646079,7828 | 164442,678 | 57450,7498 | 6788 |
| week 33 | 1878070,3105 | 1648143,4788 | 171958,4407 | 57968,391 | 6816 |
| week 34 | 1890037,6647 | 1658553,2583 | 172995,0154 | 58489,391 | 6860 |
| week 35 | 1901447.634 | 1667394.041 | 175136.202 | 58917.391 | 6901 |
| week 36 | 1913898.0194 | 1670650.5699 | 183789.0917 | 59458.3578 | 6941 |
| week 37 | 1925135.7562 | 1671885.2630 | 193341.0958 | 59909.3974 | 6972 |
| week 38 | 1937451.4414 | 1680017.2064 | 196960.8376 | 60473.3974 | 7005 |
| week 39 | 1948894.0965 | 1688271.5046 | 199637.1870 | 60985.4049 | 7046 |
| week 40 | 1960870.6353 | 1698622.8389 | 200710.3915 | 61537.4049 | 7079 |
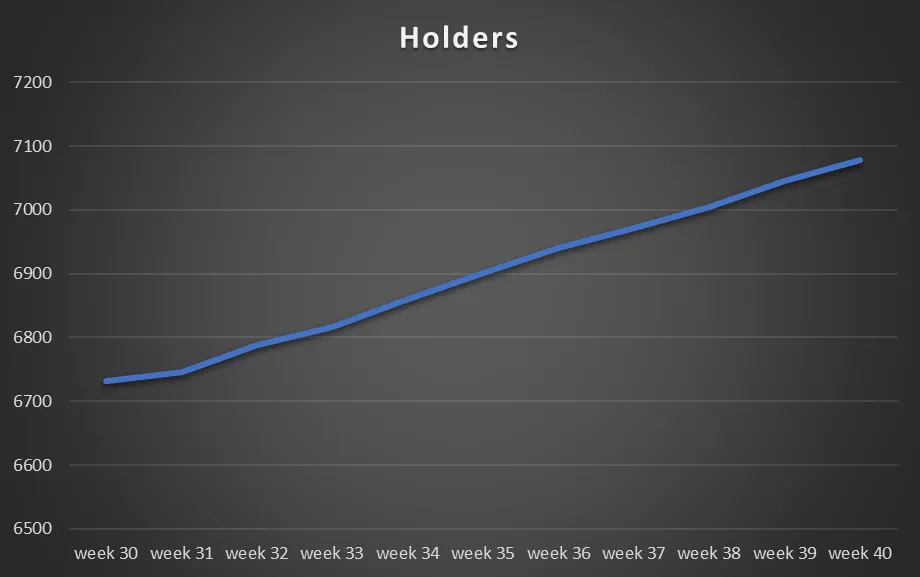
Comparing with the previous week, we have 11976.5 increase in supply, 10351.33 more ALIVE staked, more 1079.204 ALIVE liquid, more 552 ALIVE burned and 33 new holders.
| Inflation | |
|---|---|
| week 31 | 3.52% |
| week 32 | 0.72% |
| week 33 | 0.54% |
| week 34 | 0.64% |
| week 35 | 0.60% |
| week 36 | 0.65% |
| week 37 | 0.59% |
| week 38 | 0.64% |
| week 39 | 0.59% |
| week 40 | 0.61% |
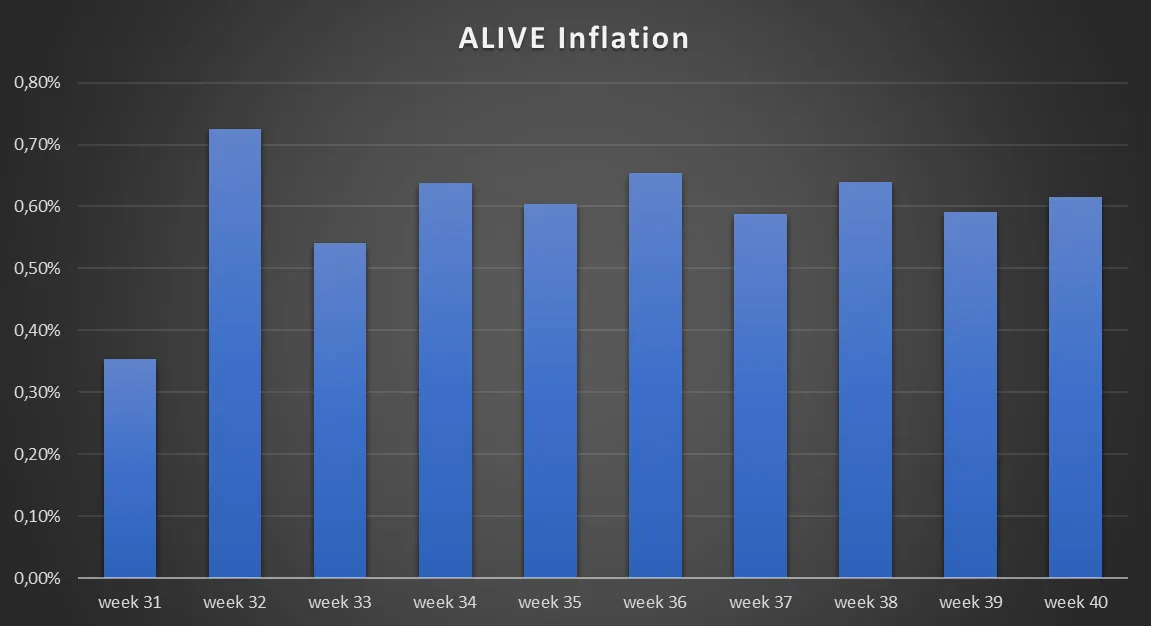
ALIVE current average inflation is 0.59%
| Supply | Stake | Liquid | Burn | Holders | |
|---|---|---|---|---|---|
| week 31 | 0.35% | 0.06% | 2.40% | 0.61% | 0.22% |
| week 32 | 0.72% | 1.88% | -31.16% | 1.02% | 0.62 |
| week 33 | 0.54% | 0.13% | 4.57% | 0.9% | 0.41% |
| week 34 | 0.64% | 0.63% | 0.60% | 0.9% | 0.65% |
| week 35 | 0.60% | 0.53% | 1.24% | 0.73% | 0.60% |
| week 36 | 0.65% | 0.20% | 4.94% | 0.92% | 0.58% |
| week 38 | 0.64% | 0.49% | 1.87% | 0.94% | 0.47% |
| week 39 | 0.59% | 0.49% | 1.36% | 0.85% | 0.59% |
| week 40 | 0.61% | 0.61% | 0.54% | 0.91% | 0.47% |
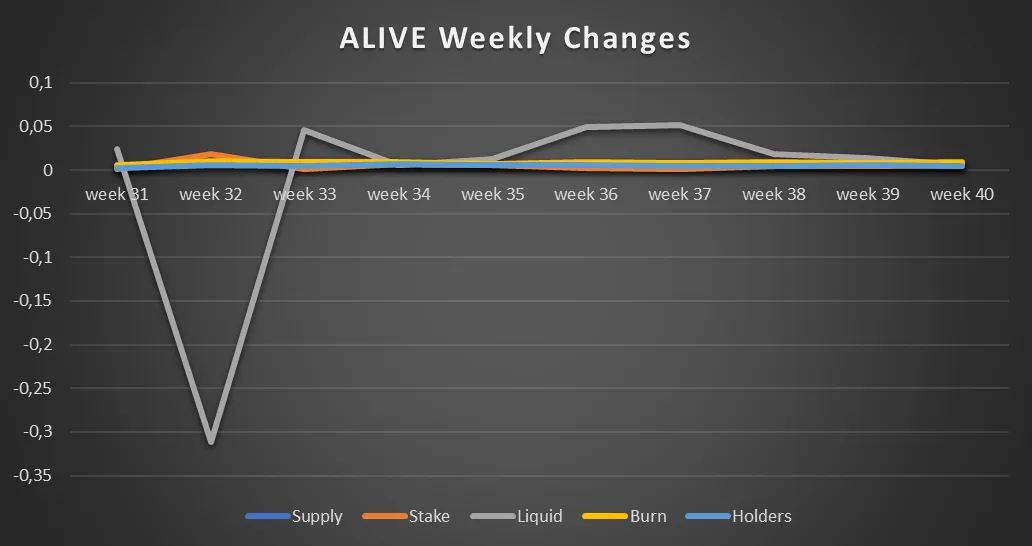
This means our supply increased 0.61%, the ALIVE staked increased 0.61%, the liquid ALIVE increased 0.54%, ALIVE burned increased 0.91% and holders increased 0.47%.
ALIVEM
ALIVEM is the ALIVE miner.
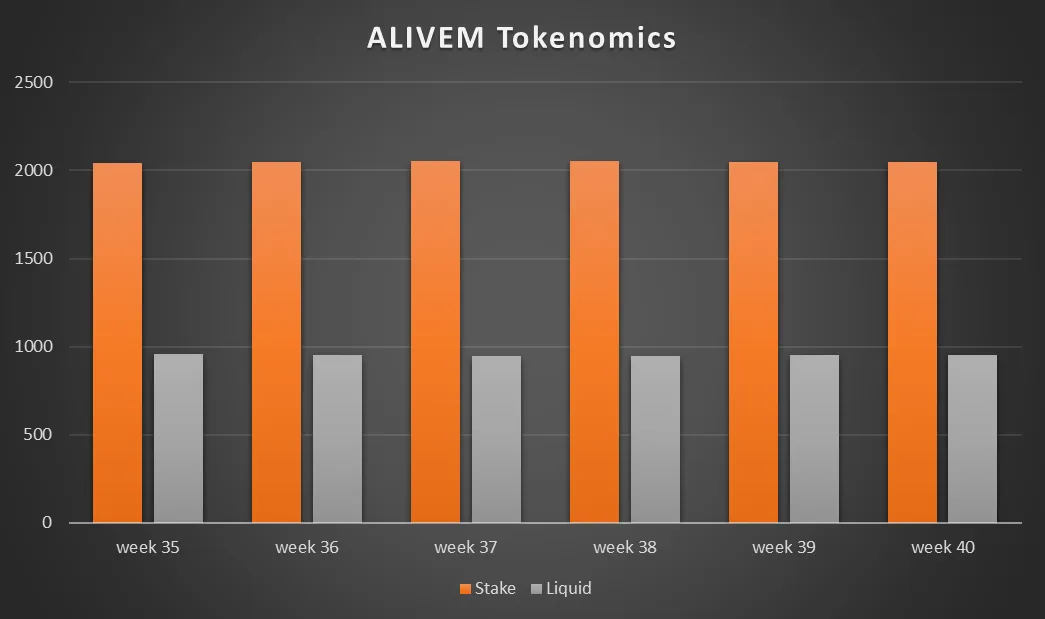
| Supply | Stake | Liquid | Burn | Holders | |
|---|---|---|---|---|---|
| week 35 | 988000 | 2042.561 | 957.439 | 985000 | 1108 |
| week 36 | 988000 | 2048.869 | 951.131 | 985000 | 1104 |
| week 37 | 988000 | 2052.884 | 947.116 | 985000 | 1104 |
| week 38 | 988000 | 2053.421 | 946.579 | 985000 | 1104 |
| week 39 | 988000 | 2049.565 | 950.435 | 985000 | 1104 |
| week 40 | 988000 | 2048.245 | 951.755 | 985000 | 1107 |
Since Supply and Burn statics have not changed, I remove them from the chart.
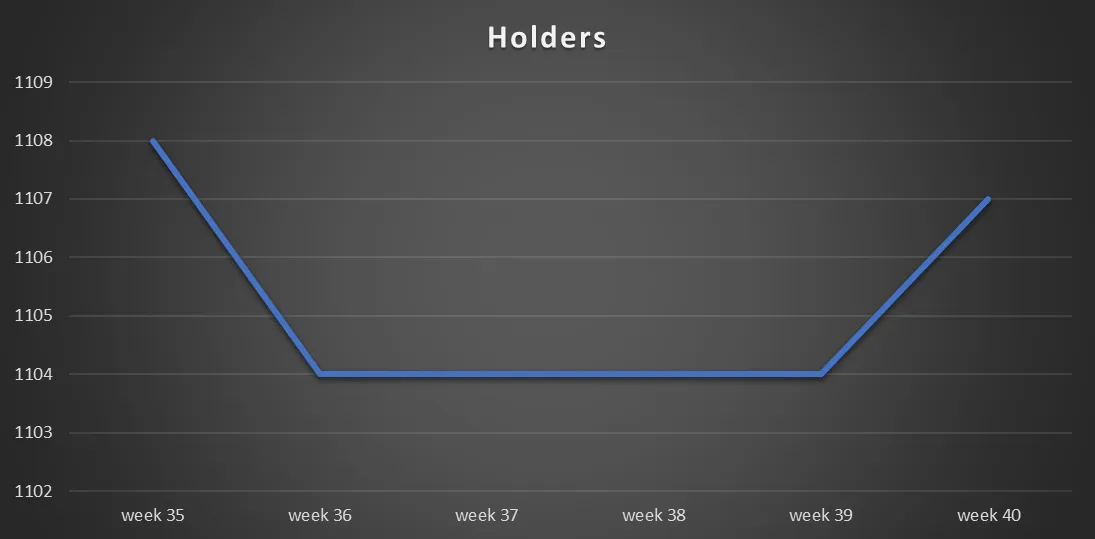
Comparing with the previous week, we have 1.32 increased ALIVEM staked, and 3 new holders.
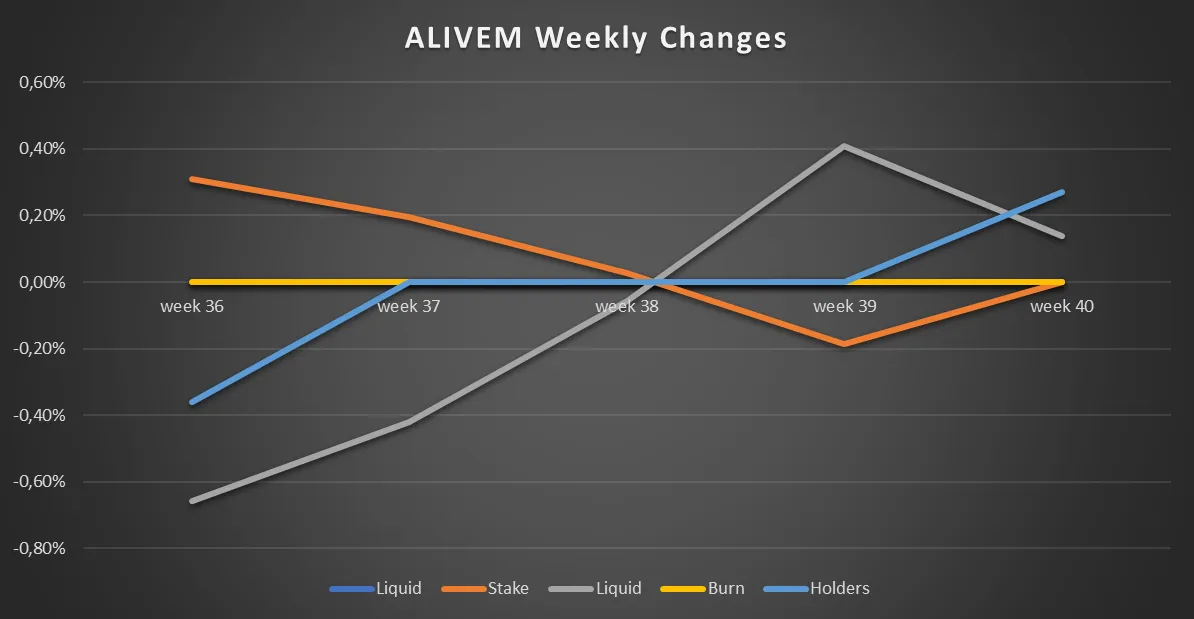
| Supply | Stake | Liquid | Burn | Holders | |
|---|---|---|---|---|---|
| week 36 | 0% | 0.31% | -0.66% | 0% | -0.36% |
| week 37 | 0% | 0.20% | -0.42% | 0% | 0% |
| week 38 | 0% | 0.03% | -0.06% | 0% | 0% |
| week 39 | 0% | -0.19%% | 0.41% | 0% | 0% |
| week 40 | 0% | 0% | 0.14% | 0% | 0.27% |
This means our liquid ALIVEM increased 0.14% and holders changed 0.27%.