

SUMMARY
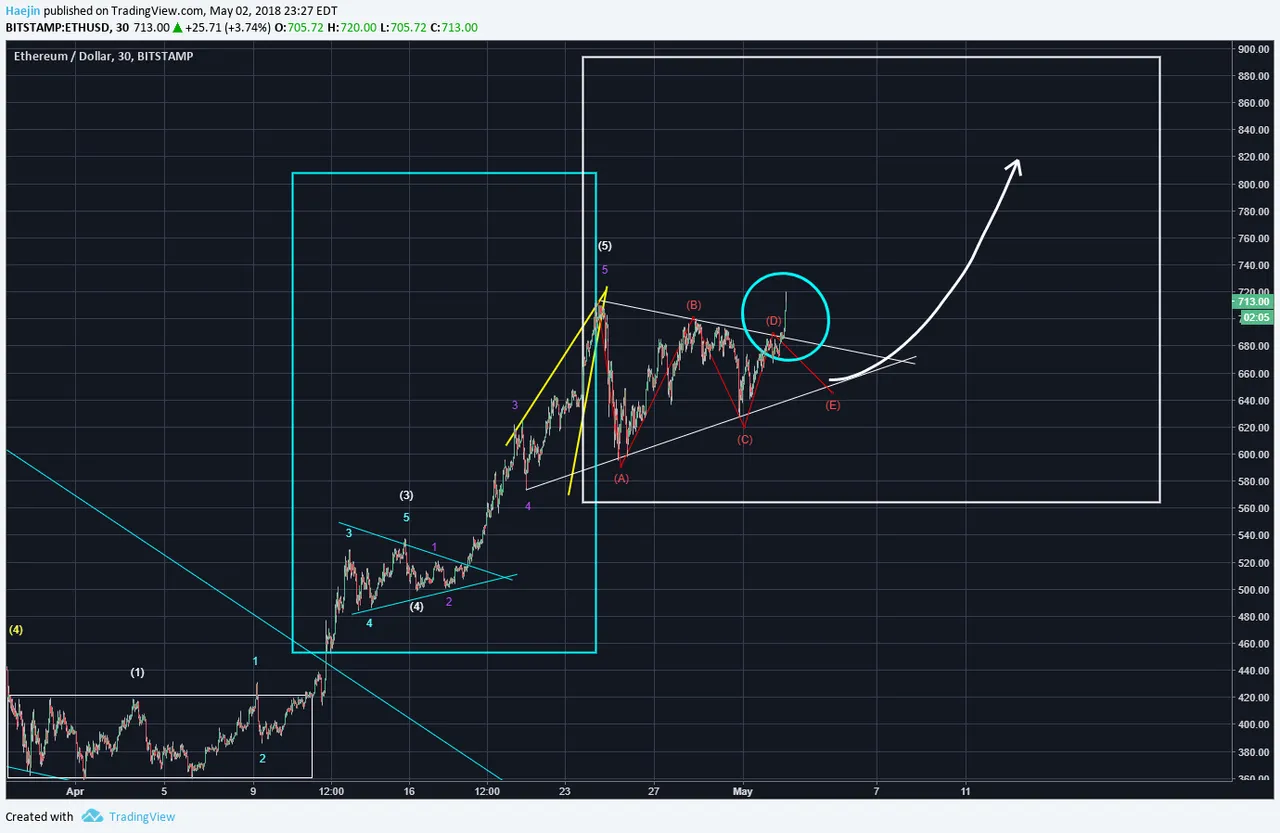
Earlier I had mentioned that Ethereum (ETH) could hold the baton and start leading Bitcoin (BTC). I also indicated the likelihood that IF ETH broke out of the triangle at the D wave; then so could BTC. The below chart shows how price for ETH surged out of the symmetrical triangle pattern (blue circle). This is very bullish!
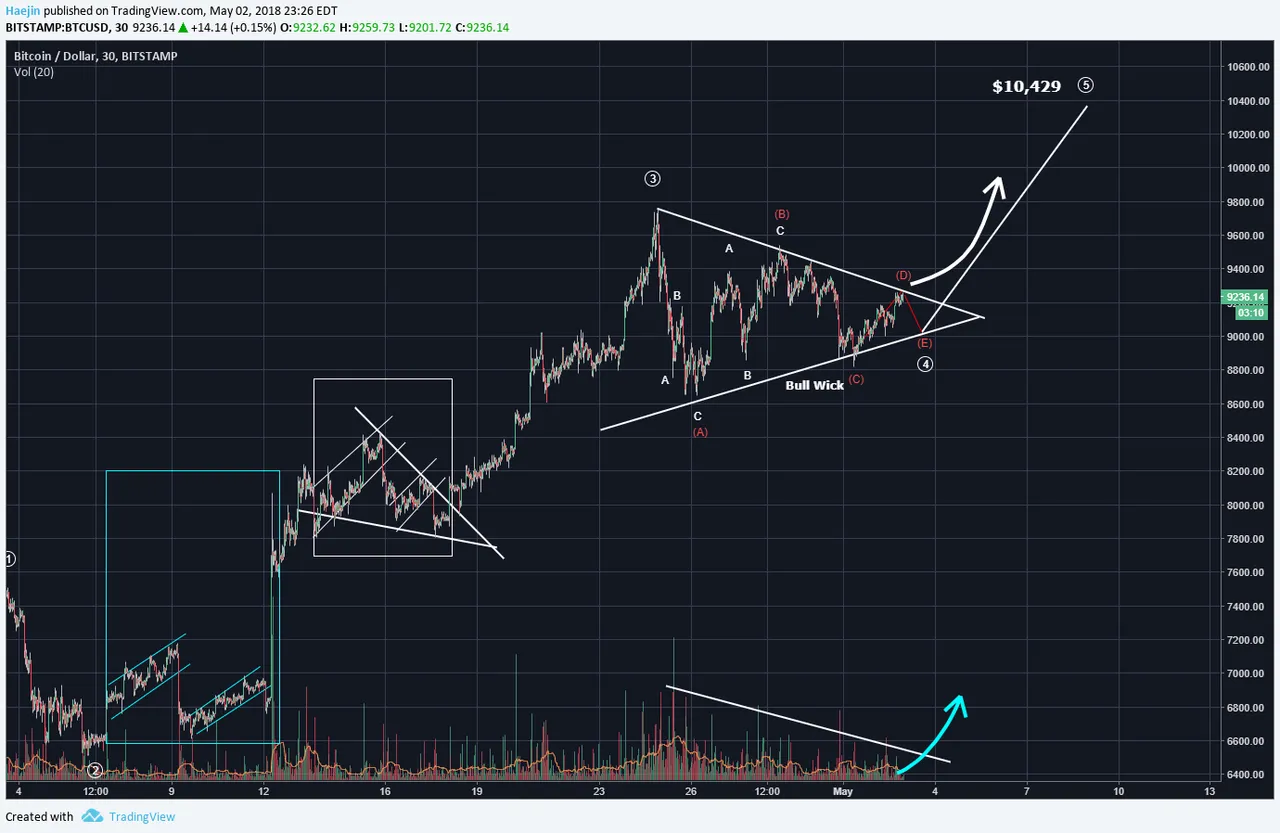
So here is Bitcoin (BTC). Will it follow ETH's lead and breakout at the D wave? The white arrow was in the prior charts and update posts and I believe that the breakout is very likely at D. Notice how the volume has been declining but soon the surge in volume too should materialize.
Legal Disclaimer: I am not a financial advisor nor is any content in this article presented as financial advice. The information provided in this blog post and any other posts that I make and any accompanying material is for informational purposes only. It should not be considered financial or investment advice of any kind. One should consult with a financial or investment professional to determine what may be best for your individual needs. Plain English: This is only my opinion, make of it what you wish. What does this mean? It means it's not advice nor recommendation to either buy or sell anything! It's only meant for use as informative or entertainment purposes.
Please consider reviewing these Tutorials on:
Elliott Wave Counting Tutorial #1
Elliott Wave Counting Tutorial #2
Elliott Wave Counting Tutorial #3
Laddering and Buy/Sell Setups.
Laddering Example with EOS
Tutorial on the use of Fibonacci & Elliott Waves
@haejin's Trading Nuggets
Essay: Is Technical Analysis a Quantum Event?
Follow me on Twitter for Real Time Alerts!!
Follow me on StockTwits for UpDates!!
--
--

