

SUMMARY
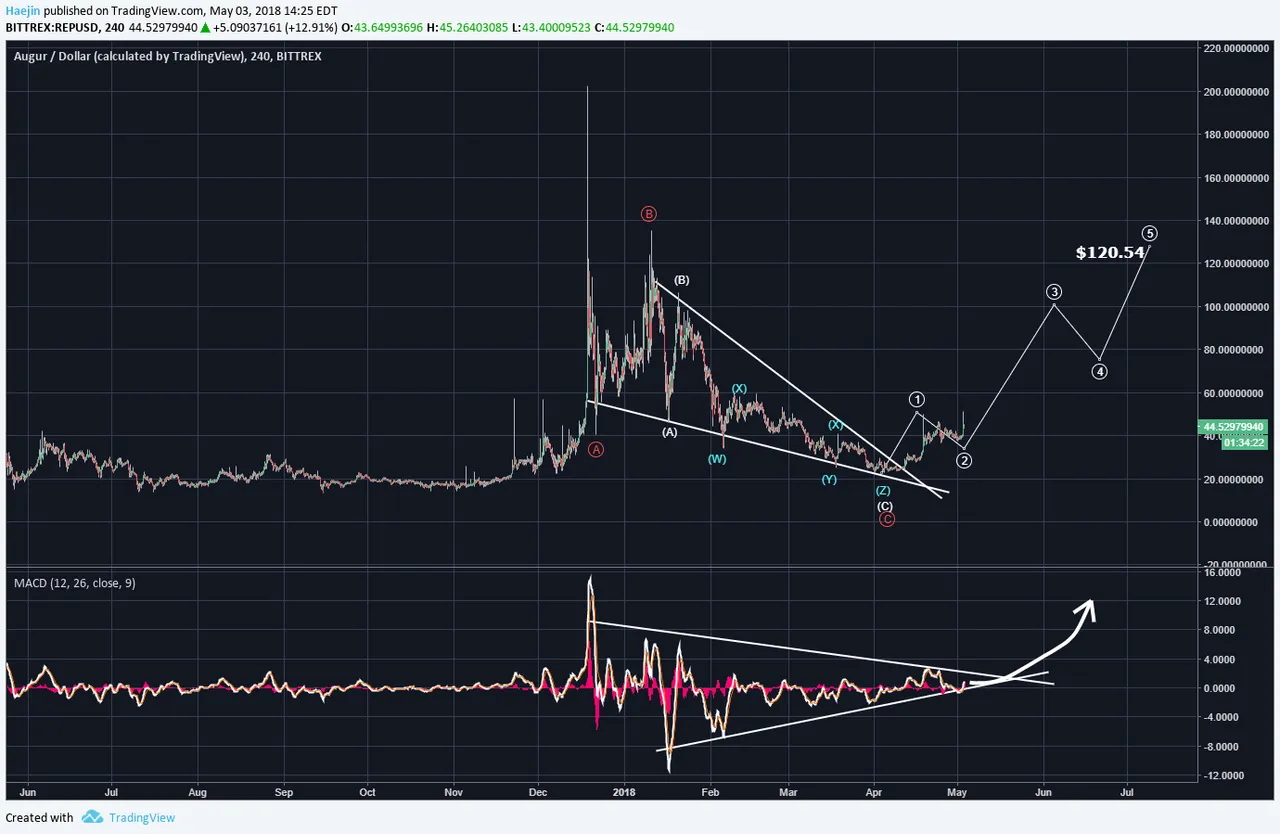
On April 8, the below chart was posted as analysis for Augur (REP) having a downward wedge pattern where price was so proximal to the apex. A breakout of a certain degree was imminent as shown by the white arrow.
![]()
Price broke out and rose as high as $51.27; delivering a 103% profit!! However, it's not done! The MACD has yet even to breakout of its own symmetrical triangle! Thus far, wave 1 and 2 are complete if REP is now going to put in wave 3; expect some vertical price moves. Wave 5 target is $120.54 or so and if one had held since $25; that's MASSIVE profit potential!
Legal Disclaimer: I am not a financial advisor nor is any content in this article presented as financial advice. The information provided in this blog post and any other posts that I make and any accompanying material is for informational purposes only. It should not be considered financial or investment advice of any kind. One should consult with a financial or investment professional to determine what may be best for your individual needs. Plain English: This is only my opinion, make of it what you wish. What does this mean? It means it's not advice nor recommendation to either buy or sell anything! It's only meant for use as informative or entertainment purposes.
Please consider reviewing these Tutorials on:
Elliott Wave Counting Tutorial #1
Elliott Wave Counting Tutorial #2
Elliott Wave Counting Tutorial #3
Laddering and Buy/Sell Setups.
Laddering Example with EOS
Tutorial on the use of Fibonacci & Elliott Waves
@haejin's Trading Nuggets
Essay: Is Technical Analysis a Quantum Event?
Follow me on Twitter for Real Time Alerts!!
Follow me on StockTwits for UpDates!!
--
--

