

SUMMARY
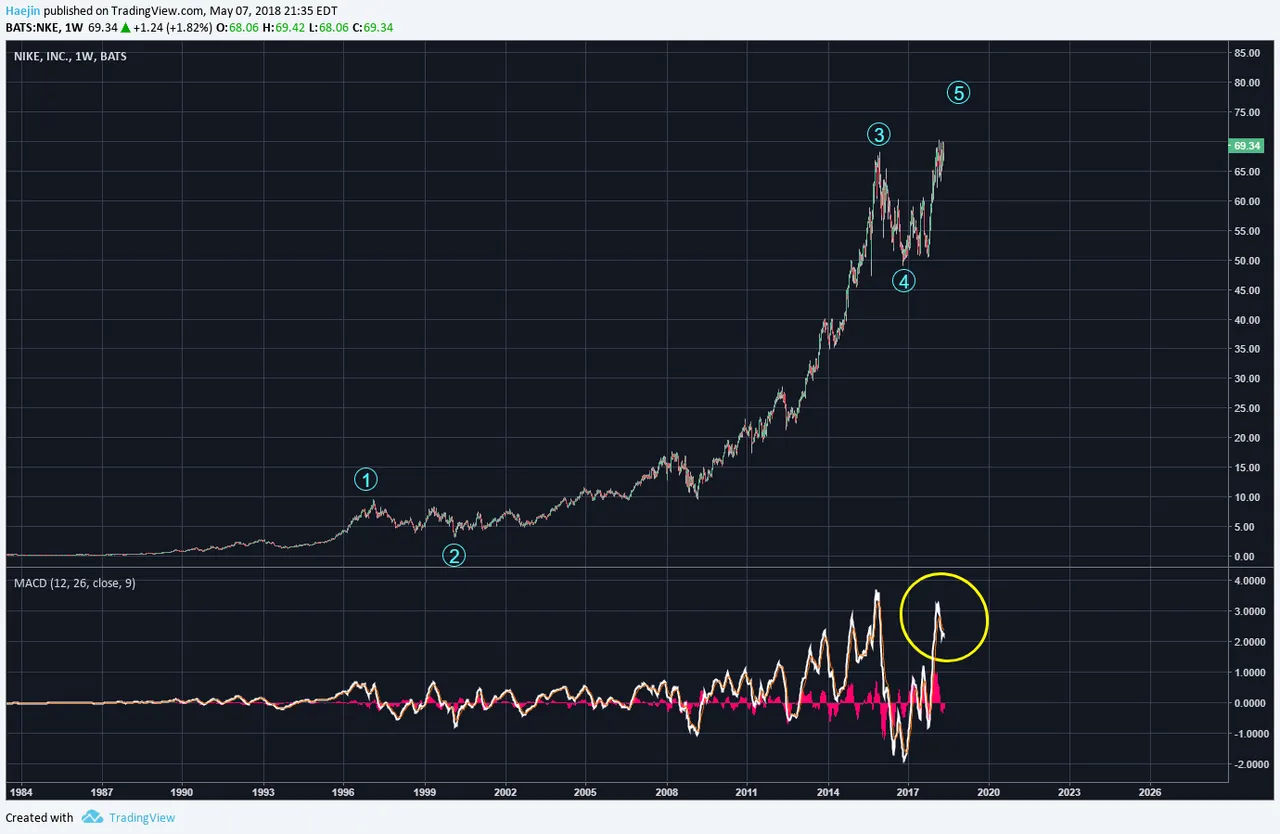
Here is NIKE's weekly chart and five waves are counting very easily and crisply. The blue 5 is either done or about to be soon complete. What happens after five waves are complete? A requisite correction. The MACD is showing a near overbought stage and that's not very bullish at all.
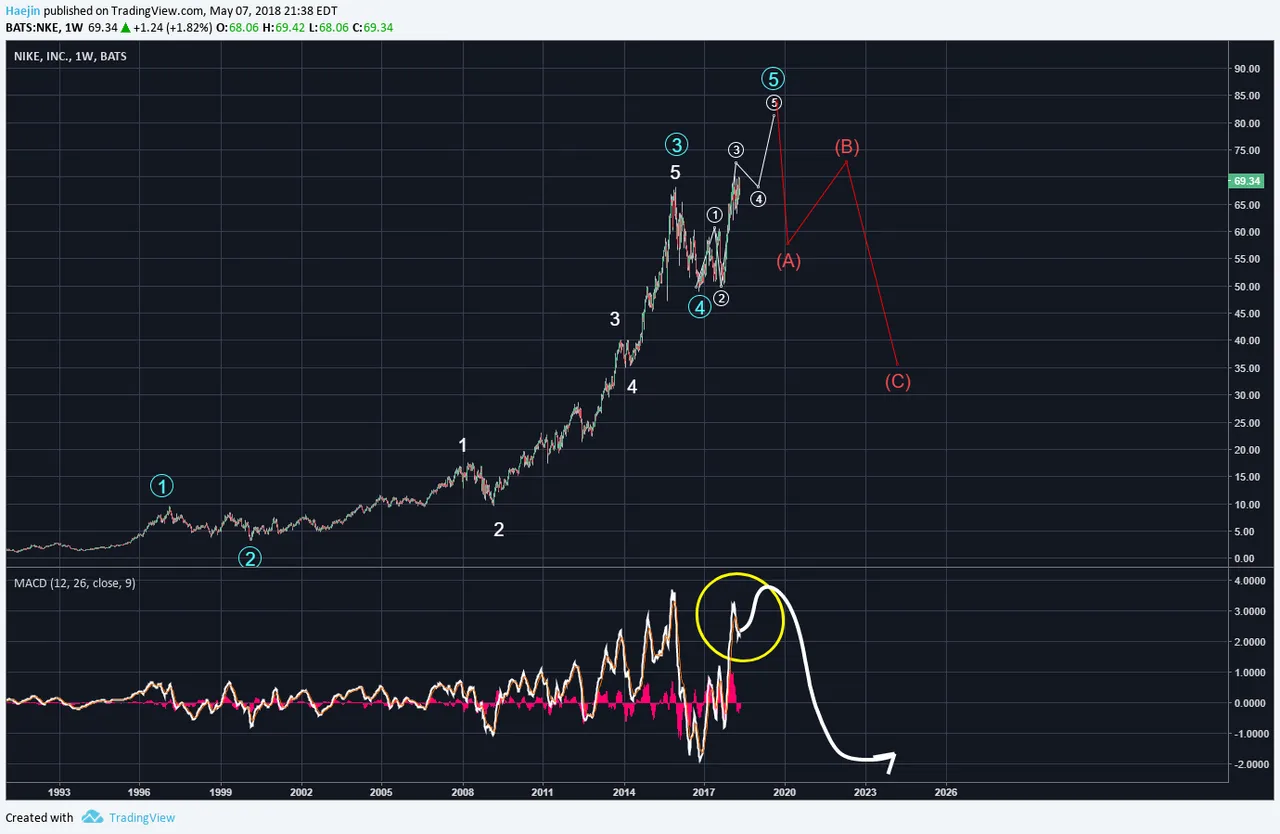
I've added the subwaves for blue 5. It's about done with 4 and 5 (white) waves remaining. There is likely a sizable ABC crash correction coming for NIKE and this decline could be scary and severe. Who know what fundamental event or news might be used as the cause; however, news or events will arrive to justify the forecast. The MACD could rise a bit more; but beward of the coming crash. Is this the time to be taking BUYING or profit SELLING actions for NIKE?
Legal Disclaimer: I am not a financial advisor nor is any content in this article presented as financial advice. The information provided in this blog post and any other posts that I make and any accompanying material is for informational purposes only. It should not be considered financial or investment advice of any kind. One should consult with a financial or investment professional to determine what may be best for your individual needs. Plain English: This is only my opinion, make of it what you wish. What does this mean? It means it's not advice nor recommendation to either buy or sell anything! It's only meant for use as informative or entertainment purposes.
Please consider reviewing these Tutorials on:
Elliott Wave Counting Tutorial #1
Elliott Wave Counting Tutorial #2
Elliott Wave Counting Tutorial #3
Laddering and Buy/Sell Setups.
Laddering Example with EOS
Tutorial on the use of Fibonacci & Elliott Waves
@haejin's Trading Nuggets
Essay: Is Technical Analysis a Quantum Event?
Follow me on Twitter for Real Time Alerts!!
Follow me on StockTwits for UpDates!!
--
--

