Bitcoin has been on a parabolic bull run this weekend, smashing back up through the $10k mark with ease and even pushing on up past $11k before settling just below it, as of writing. This truly looks like the bull market that we have all been waiting for throughout 2018. In fact all this year, since we bottomed out at $3.2k in mid December, Bitcoin has been steadily climbing. And particularly since 2 April, when we saw the Bitcoin price climb almost 20% in one day, most traders have been more and more certain that we are in the next bull run. But I want to look at the theory that says we may not be out of the bear market yet, as slim as that sounds, considering this weekend’s huge price pump.

Parabolic bull run but is it really the official bull market?
This is just a theory regarding the odds that we may not be out of the bear market yet. It’s good to see both perspectives and to be flexible, adaptable and open to all scenarios, lest our speculation or technical analysis theory does not consider all the variables, and there are a lot of variables in this market. Considering the fact that Bitcoin is up over 230% this in the past six months since the bottom, I would personally say we are in the next bull run. But I’m open to the opposite also being possible.
There is another advanced theory that says we should beware this parabolic move. Let’s look at the theory that says we may not be out of the bear market yet, at least so that we are aware of it, not that it’s definite because nothing is definite in crypto. Nobody can say for sure, but we can look at past price action, past patterns and also take into consideration expert analysis of market theory and technical analysis from all angles.
Elliot Wave Theory
If you study TA you will eventually come across an advanced system called Elliot Wave Theory. It describes how markets all move in waves or cycles, and Bitcoin is no exception. Now what if the price action we are seeing on the Bitcoin chart right now is not the bull market, and what if Bitcoin has not actually bottomed? It sounds absurd considering the current parabolic moves, but just because it looks like a bull market, let’s just consider the opposite so that we are open to the options. Nobody can say for sure either way so as traders we keep an open mind and are never attached to one theory or another. We let price determine and we follow. Here are some reasons why a bear market may not be over:
1- Sentiment
Currently the sentiment readings for Bitcoin are at serious highs. People are euphorically bullish in sentiment at present and understandably. We have just reached new highs for this year. In fact we are at extreme 2017 levels in sentiment, something we saw last just before the ATH (all time high) of December 2017, when Bitcoin approached $20k. Twitter is saying we will never see sub-$4k ever again for example. Extreme bullishness is a warning though when everyone is thinking the same way. We need to consider the contrary side. Contrarians are mavericks who often pre-empt the herd in these markets and seem like outsiders or fools, until later, when hindsight provides the 20/20 perspective of clarity. So with such bullish sentiment that we are way out of the bearish cycle, we need to at least consider what the opposite might mean, just in case, and so that we can be prepared either way.
2 – The speed of the current movements
The latest parabolic upward trend of Bitcoin has gone on for so long now, and at such an extreme curve upwards – 45 degrees – that it seems unrealistic and suspect. The upward move has been too fast to be sustainable. It’s not normal. We are almost half way back to the ATH, with only a doubling left to take us back to ATHs. Compared to the previous bull runs in 2015 and 2017, there have been far less retracements. We are still expecting that 30% pull back. But more importantly, if we look at the bear market of 2014, which bottomed in early 2015, it took a full 18 months for price to regain 50% of its previous decline. This time around so far it has taken a mere six months to get to the same place of the 50% retracement mark at $10k, half way down from the high of $20k. Something is not quite right.
3 - What about the missing failed rallies?
In early 2015, when price bottomed and started wanting to climb back up, there were two significant failed attempts before price really became genuinely bullish. This is a sign of a healthy market, and their absence is a sign that all is not right with this current parabolic move back up to current prices. We are still waiting for that pull back in price. Normally there should be a 30% retrace around now, or slightly more, but it has yet to manifest. Experts have been calling for it for weeks already.
4 - Importance of the 21 Weekly Moving Average indicator (21W SMA or EMA)
A healthy bull market is steady and measured and has numerous retracements along the way. Admittedly we had a couple of decent pull backs, one in mid May and one in the first week of June this year but that was only about 18% at the most for the latter larger retracement. In the past bull run leading up to the ATH, price had several pull backs to the 21 weekly MA. This is a crucial indicator that cannot be overstated. There is no other indicator more valuable to show whether we are in a bear or bull market. In the past we saw that once price crossed above the 21 weekly MA, it suggested that we were in a bull run. This year we crossed back up over the 21 W MA on that feverish week of 2 April, when price spiked massively. It could well be that experts were observing the bullish cross up over the 21 W MA and so began going long at that very moment.
5 Where are the retracements?
So not only have we yet to see one or two failed attempts to cross over the 21 W MA, but since crossing that famous indicator, we have not once come even close to a move back down to retest it. We have simply gone parabolic for the past 12 weeks, leaving the 21 W MA further and further behind. This is unsustainable and Bitcoin is therefore more than likely due to retrace back down to it at some point. At the moment the 21 Weekly EMA is at $5752 on the Binance BTC/USDT chart. It might vary form one exchange to another fractionally but there you have it. Statistics and past history determine that price will – at best – come back down to meet the 21 W MA eventually. And since the MA keeps moving with time and price, it is on the uptrend, but at some point price will fall back down to meet is as it rises up and that meeting could be somewhere like the much observed $6900 area of previous support or resistance for example.
B-Waves or Bear market rallies
The overall picture currently shows that current price action is, in fact, too bullish, moving to “extreme greed” on the indicator. I’m all for a positive run but this is not normal. And this is where experts will refer to Elliot Wave Theory. This is the real detail behind the theory that the bear market is not over. According to EWT we are very possibly now in a B-wave or Bear market rally.
“B-waves are phonies. They are sucker plays, bull traps, speculators’ paradise, orgies of odd-lotter mentality or expressions of dumb institutional complacency (or both). They often are unconfirmed by other averages, are rarely technically strong, and are virtually always doomed to complete retracement by wave C. If the analyst can easily say to himself, ‘there is something wrong with this market’, the chances are it’s a B wave.”
from The Elliot Wave Principle by Robert Pretcher
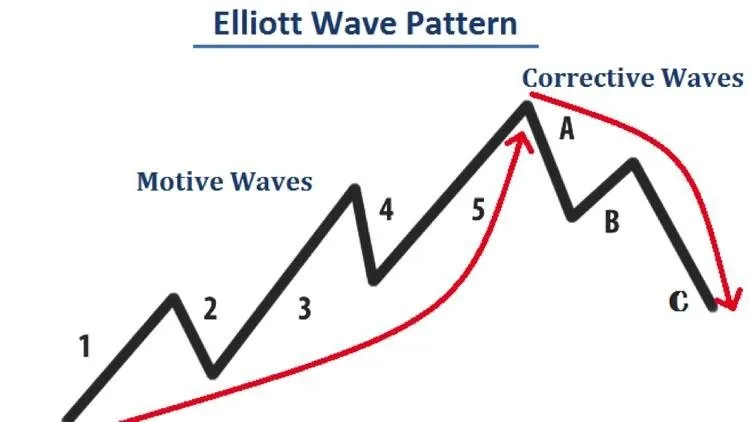
Elliot Waves patterns are made up by price making 5 moves in a zigzag up, followed by 3 moves in a zigzag down, as seen in the graphic here. 1-5, followed by a-b-c. The ATH at $20k in December 2017 was the top of the fifth leg up for the last wave 5. The bear market of 2018 was the ‘a’ wave down until the bottom at $3,2k in December. Presently it appears as if we are in the next bull run up, but EWT suggests that this current leg up could simply be the ‘b’ wave of the a-b-c corrective pattern before the actual next 1-5 bull run up beyond $50k.
This ‘b’ wave could even climb right up to current levels over $11k, or higher still amazingly, even up close to the last ATH, and still be considered a bear market rally, a trap or a fakeout. Thereafter a massive retrace or ‘c’ wave down will follow, before the real bull market. And this wave ‘c’ could go lower than we expect. This exact scenario played out in the 2014 fakeout before the real bull run started. Price went up above the 21 W MA but retraced below it and remained there for over a year from July 2014 until October 2015 (with still another false break above the 21 W MA that lasted a few weeks).
Wave C could still take us to the real bottom below $3 200
If this is in fact a ‘b – wave’ fakeout, it could peak at the 0.618 Fib retracement back up around $13,5k, before falling back down below $3,2k to as low as $1,8k - $2,2k before starting the real bull run. So theoretically we may have not have seen the bottom yet, as absurd as that sounds at this euphoric point. Remember that to be considered a real and healthy bull market, Bitcoin price must retrace to retest the 21 W MA eventually, so a big dip in price is due. If it bounces and keeps climbing then that is good, but it could fall below, and if it does then watch out for the real bottom below $3,2k. I’m not saying anything is certain at this point, but at least it is good to know the possibilities based on past price action as well as detailed technical analysis as described by real experts.
I hope this gives you some food for thought. What’s your opinion? Is this the bull market, or is there another bear move to new lows ahead? Let us know in the comments below.