
Every month I produce a Post benchmarking report with the aims of:
• Aiding the Steemit Community with a place to benchmark their posts and growth
• Create a report that can be used for comparisons in other periods
• To track my personal targets and record achievements
Over the last few months I have added new data to this report, including comparisons to the same period last year, top earn authors and authors with the highest number of votes.
If you missed last months full report you can read it here:
/@paulag/march-steemit-post-benchmarking-report-blockchain-business-intelligence
Since I produced last month’s report, I have since found out that any posts with a payment of less than $0.02 are not paid out. This makes a material difference in the comparison on previous month, so I have re-ran the April report for comparison under this criteria
Repository
https://github.com/steemit/steem
Financial Performance
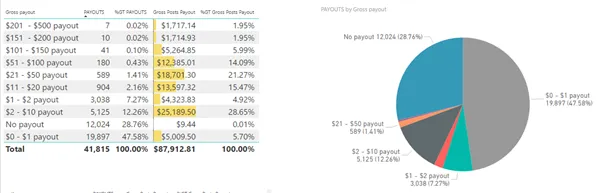
April ’17 Report
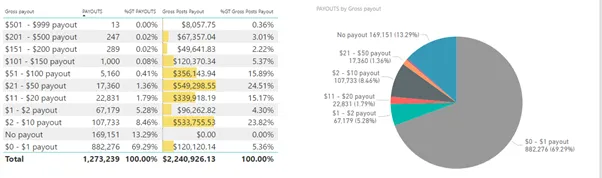
March’18 Report Pre Adjustment
March’18 Report Post Adjustment
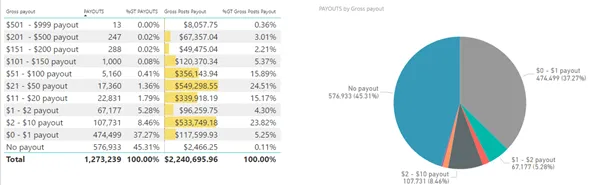
As post with a payout value of less than $0.02 are not paid out, we can see this impacts the March % of posts with no payout, increasing it from originally reported 13.29% to 45.31%. It also reduces the % of posts with a payout of less than $1 from 69.29% to 37.27%
April ’18 Report
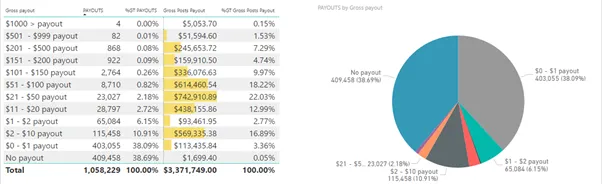
In April ’18 the % of posts with No payout was 38.69% down from 45.31% in March. Although in April ’17 this was 28.76%
The % of posts with a payout of <$1 is up to 38.09% from 37.27% in March. The number of posts that earned over $500 increased from 13 in March to 86 in April
The average post payout value in April ’18 was $3.18 .In March it was $1.76 SBD, $2.56 SBD in Feb and $3.81 SBD in Jan. If we exclude posts with no payout the average post payout increases to $5.19 SBD. In Feb the average post payout excluding post with no payout was $2.03 SBD. In April ’17 these values were $2.10 SBD and $2.95 SBD.
The number of posts reduced from March 18 to April 18 by 18%, although the payout value increased by 50% for the same period.
However from April ’17 to April ’18 the number of posts increased by 2431% and the total payout value by 3735%
My Stats
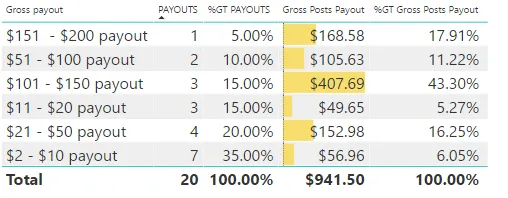
With 13 less post in April than I had in March, my total post payout is up. This month I had 6% of posts in the payout range of < $20 SBD and 67% of my posts earned more than $101. My posts have earned on average $47 which is considerably higher than the average post on Steemit.
Top Authors based on payouts
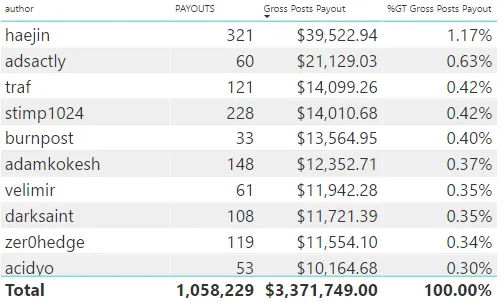
From this report we can see that many of the top earns from last month are still on the list.
Top Category’s
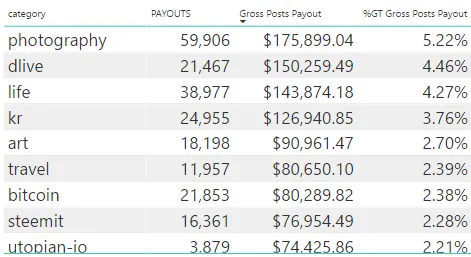
The top category remain the same as last month, however Dlive has now taken second place pushing life into third. There is some movement between the remaining categories.
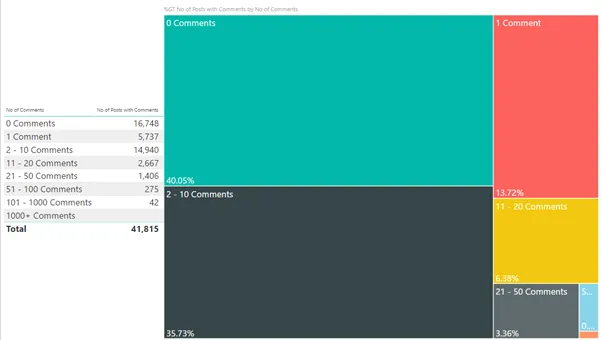
Comments
April ‘17
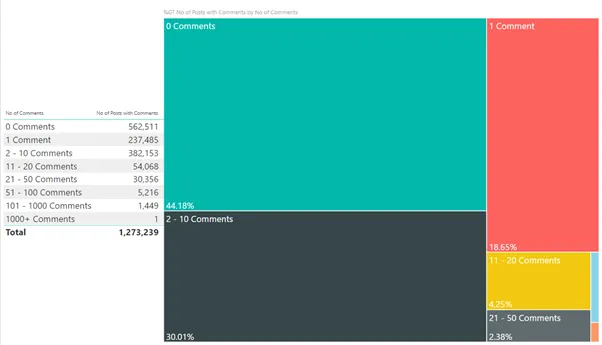
Mar ‘18
April ‘18
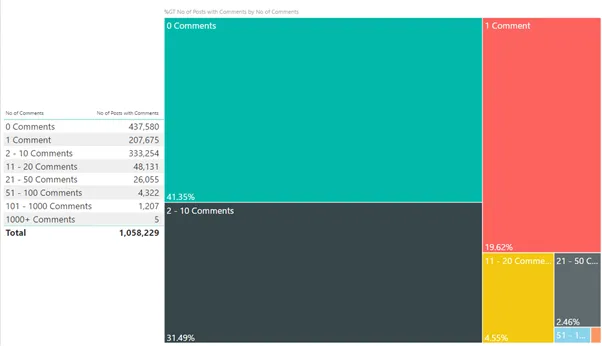
The % of posts with no comments is down on March and is for April was 41%. This has been offset with the % of posts with 1 and between 2-10 comments.
From April ’17 to April ’18 the % of posts that received no comments increased from 40% to 41%.
My Stats
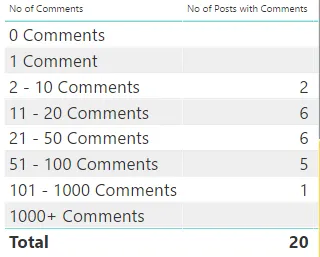
In April 90% of my post received 11+ comments. Last month I was a little disappointed in the engagement levels on my posts but this month 30% of my posts received 51+ comments. One posts even received more than 100 comments.
Votes
April ‘17
March ‘18
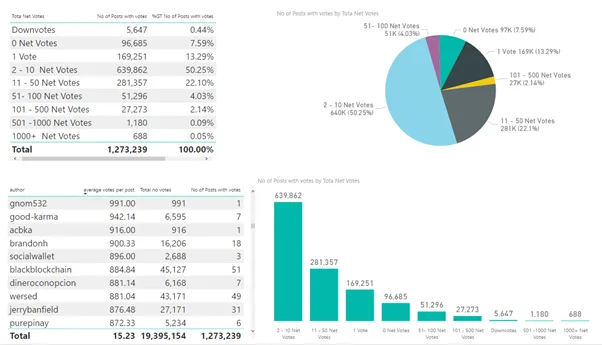
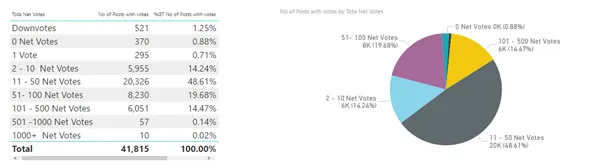
April ‘18

The % of posts with 0 net votes has reduced from 7.6% in March to 5.3% in April. However this was only 0.88% in April ‘17.
The average number of votes per post in April ‘18 was 18.97 up from 15.23 in March 18.
My Stats
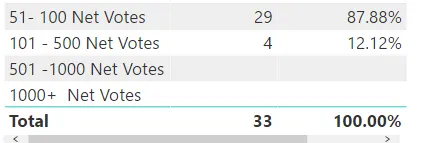
Awesome 100% of my posts received 51+ votes without the use of voting bots. Go girl. Could not be happier.
Other Data
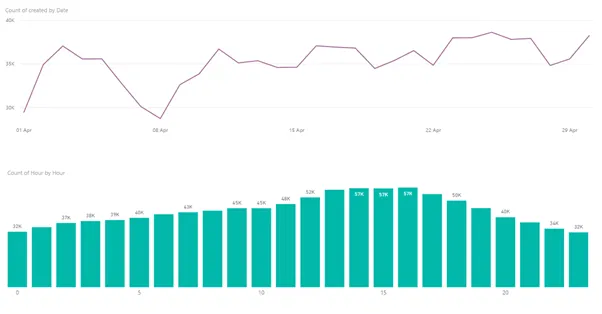
The line chart above represents the number of new posts per day in April 18 and the bar chart below that shows the peak posting hours.
April saw a general uptrend trend in the number of posts made per day.
Conclusion
As the price of STEEM and SBD had a nice rise April, this has had a direct impact in the worth of a vote and so the financial performance of posts.
Last month I found it very interesting that the average number of posts per day fell in April although we have a very high month with new accounts registering. The average number of posts per day also feel in Feb. I wondered if this is directly related to the price of STEEM and SBD as people are not earning the same? This month we seen another decrease in the number of posts, along with a decrease in the number of new users to the site. And we see this with a price increase. Kind of means my questions from last month are answered.
If you missed the report on new users for April you can check it out here
/@paulag/april-18-new-steemit-user-report-blockchain-business-intelligence
With regards to my own data, I am really happy to see the increase in engagement as the drop was concerning last month.
So how did your posts preform in April ’18 - Please do comment below and let me know.
The Datasource and Query
As always I have connected to Steemsql managed by @arcange using Power BI and the query is used
for 2018 data was
SELECT author, category, created, children, total_payout_value, net_votes, pending_payout_value FROM Comments (NOLOCK) where created >= CONVERT(DATE,'2018-04-01') and created< CONVERT(DATE,'2018-05-01') and depth = 0And 2017 query was
SELECT author, category, created, children, total_payout_value, net_votes, pending_payout_value FROM Comments (NOLOCK) where created >= CONVERT(DATE,'2017-04-01') and created< CONVERT(DATE,'2017-05-01') and depth = 0I am part of a Blockchain Business Intelligence community. We all post under the tag #blockchainbi. If you have an analysis you would like carried out on Steemit data, please do contact me or any of the #blockchainbi team and we will do our best to help you...
You can find #blockchainbi on discord https://discordapp.com/invite/JN7Yv7j