

SUMMARY
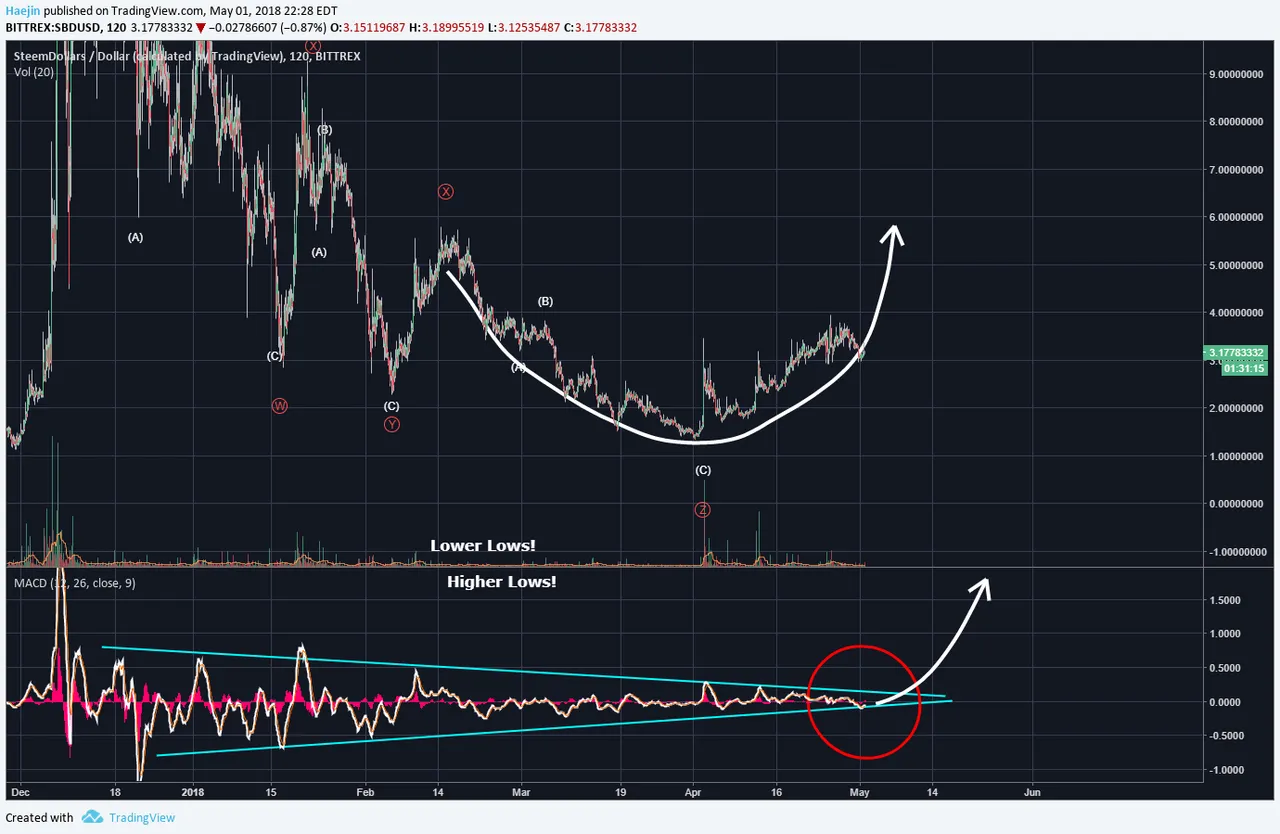
For Steem Dollar (SBD), the MACD indicator is tunneling through the narrowest crevice of the symmetrical triangle pattern. People, this kind of situation usually does not last too long because the pressure of it is not sustainable (red circle). Also, the overall countours of the price bars is putting a fine looking rounded price formation (white arrow).
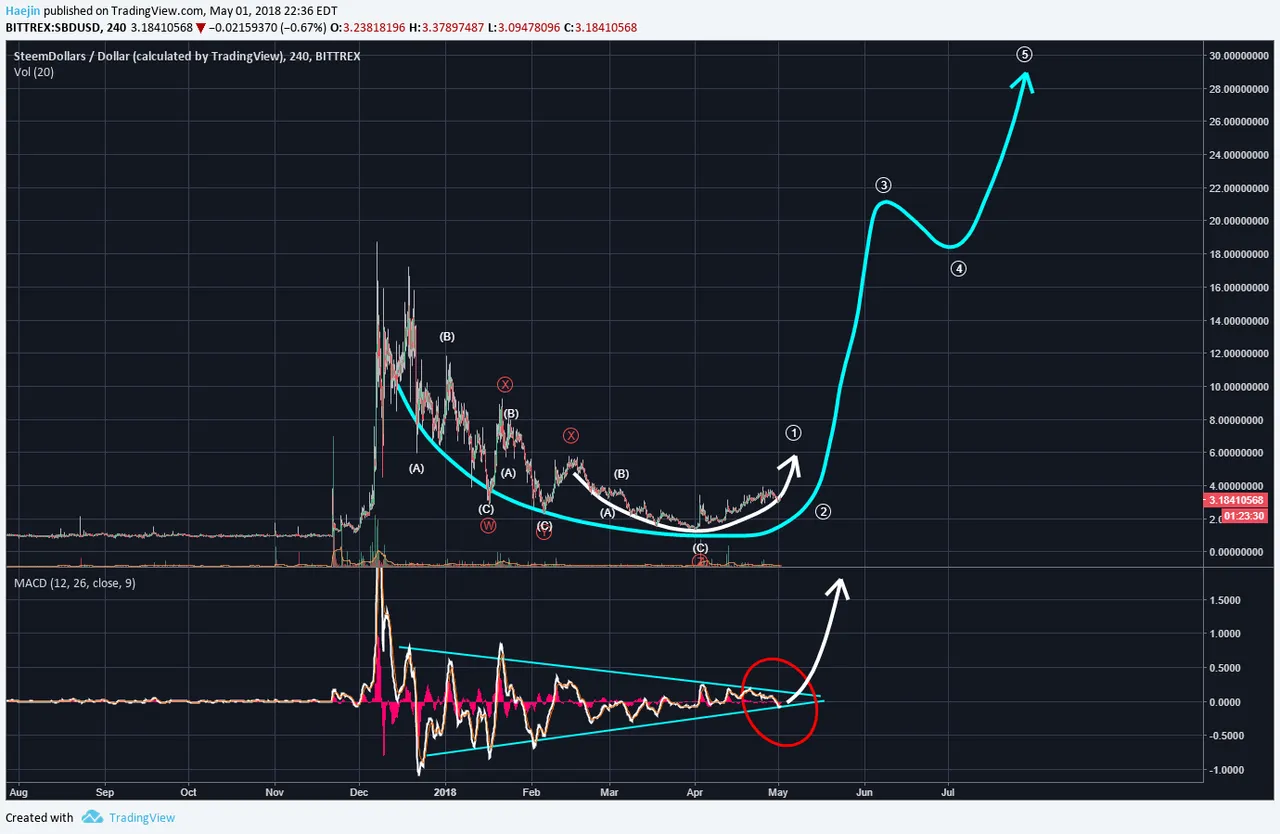
Now, the white rounded price pattern is basically within the larger rounded formation (blue). While my hand drawn line is not as steady as a mechanically traced outline, it does follow the projected five wave impulse to a likely all time new highs. I believe there is also a strong probability of an inversion opportunity.
Legal Disclaimer: I am not a financial advisor nor is any content in this article presented as financial advice. The information provided in this blog post and any other posts that I make and any accompanying material is for informational purposes only. It should not be considered financial or investment advice of any kind. One should consult with a financial or investment professional to determine what may be best for your individual needs. Plain English: This is only my opinion, make of it what you wish. What does this mean? It means it's not advice nor recommendation to either buy or sell anything! It's only meant for use as informative or entertainment purposes.
Please consider reviewing these Tutorials on:
Elliott Wave Counting Tutorial #1
Elliott Wave Counting Tutorial #2
Elliott Wave Counting Tutorial #3
Laddering and Buy/Sell Setups.
Laddering Example with EOS
Tutorial on the use of Fibonacci & Elliott Waves
@haejin's Trading Nuggets
Essay: Is Technical Analysis a Quantum Event?
Follow me on Twitter for Real Time Alerts!!
Follow me on StockTwits for UpDates!!
--
--

