S&P 500 How Low Will it Go.......

I have been trying to make sense of the stock markets recently which can be difficult considering the feds interference, there has been a lot of talk of a peak being reached which also peaked my interest (excuse the pun), below is the daily timeframe of the S&P 500 and from what i am seeing it looks as if this market wants to go higher as the trend line seems to be holding, there is however bearish momentum and a possible degree of fear in this market.

Screen Shot 2017-08-23 at 00.35.46.png

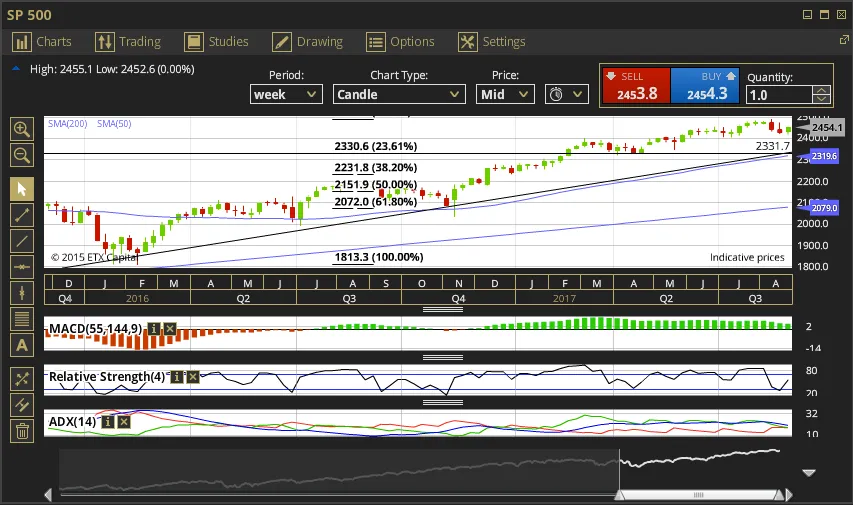
Below is the weekly timeframe which seems to tell a slightly different story with a strong level of support presenting itself around the 2331.7 level, there is also bullish momentum albeit weak, i would personally like to see this market pullback by about 15% and have been anticipating this for some time to no avail.
Screen Shot 2017-08-23 at 00.47.38.png

The problem with this type of analysis is that we are working with averages and the fed pumping this market up can cause some indicators to give false signals, so deciding where to position ones self in this market can be like flipping a coin or a game of eeny meeny miney moe.


Thanks for reading and if you found this interesting consider upvoting, following and resteeming.

P.S. If you are new to Steemit or have low SP check out Steemfollower to increase your rewards.

P.P.S. If you have an interest in purchasing alt-coins check out Cryptopia.

Previous Blog|Next Blog

H2
H3
H4
Upload from PC
Video gallery
3 columns
2 columns
1 column
2 Comments