
I've been asked on numerous occasions to produce a chart showing Steem Power growth over time. It would be nice to see, and I'm aware that there is a chart at https://steempeak.com/me/dashboard that gives recent growth, but it seems to go back a few months in time - I've not clicked the 'load more data' button' to find out how far as yet.
Is there anywhere you can see a chart of your SP history?
After receiving confirmation from SteemSQL boss @arcange that the data isn't held in my favourite access point, I thought I'd have a go a putting something together anyway. This is another Post that almost hit the trash, but with a bit of glue and a lot of fudge, I have something reasonabily OK to present. That being said, this is NOT accurate and should only be seen as a guide.
- Add the power-downs together, stick a 'minus' in front and group by date
- Add the transfers_to_vesting together and group by date
- Add the rewards in VESTs together and group by date
The SQL bods among you will instantly notice where the fudge is, relating to (3) above:
select sum(sp), cast(month(timestamp) as varchar(20)) + '/' + cast(year(timestamp)as varchar(20)) from (
    select cast(left(deposited, len(deposited)-6) as float)*-1 as sp, timestamp from VOFillVestingWithdraws where from_account = 'abh12345' union all
    select amount as sp, timestamp from txtransfers where [from] = 'abh12345' and type = 'transfer_to_vesting' union all
    select reward_vests*515/1000000 as sp, timestamp from TxClaimRewardBalances where account = 'abh12345'
) x group by cast(month(timestamp) as varchar(20)) + '/' + cast(year(timestamp)as varchar(20))
order by cast(month(timestamp) as varchar(20)) + '/' + cast(year(timestamp)as varchar(20)) asc
Yep, I just made up the number for the STEEM per MVESTS. Today we are at around 498.5 STEEM per MVESTS, I suspect this number started almost 3 years ago at 450/460. I'm thinking that if I could find a history of STEEM per MVESTS, it would be possible to produce a more accurate chart....
Does anyone know if this STEEM/MVEST history is available anywhere?
My Chart
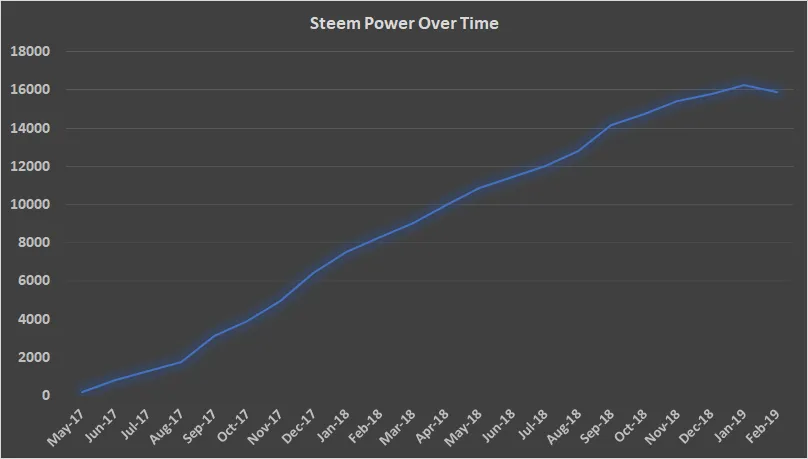
Despite the inaccuracies, I can still see a couple of points of interest. August/September 2017 - full time to Steem and a nice move on the chart. September 2018/Now - Slow gains due to power-downs, and ending with a decline in February (so far).
I'm not as excited as I thought I would be to have this chart, probably because I know it's not accurate, and I can see visually that the last few months have been slow (when really they should be showing faster growth).
Alright, who wants a wonky chart? You get what you pay for I guess :P
Asher