
Repository
https://github.com/steemit/steem
Every month I was producing a Post bench-marking report with the aims of:
• Aiding the Steemit Community with a place to benchmark their posts and growth
• Create a report that can be used for comparisons in other periods
• To track my personal targets and record achievements
Over the last few months I have added new data to this report, including comparisons to the same period last year, top earn authors and authors with the highest number of votes. I have also added details of flags and I have added more statistical calculations to the mix, as per requests :-)
Please note this data is based on Posts and not Comments.
I missed the report last month so both July and August results are included in this post. I am wondering, do you this this report provides more value of it is done every month or every second month? Please do leave your feedback below.
July 18
Financial Performance
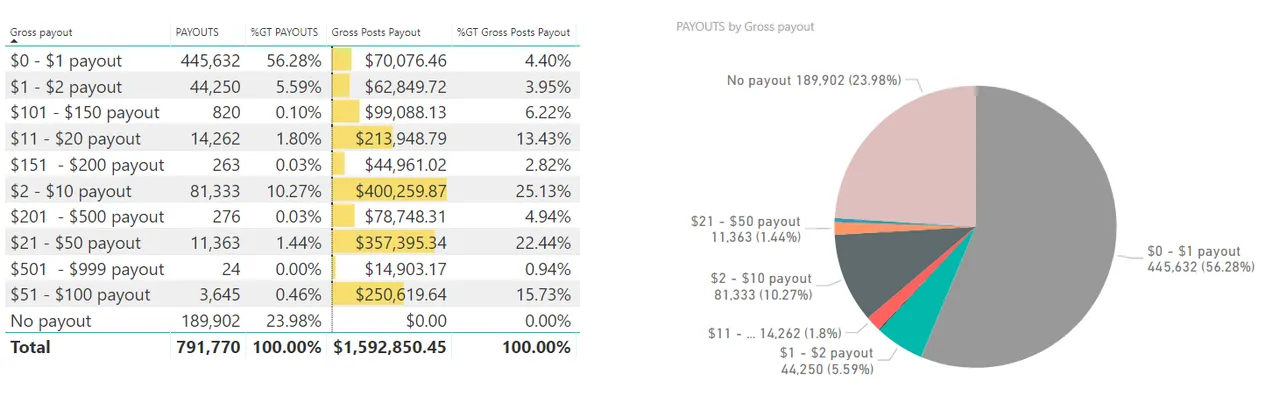
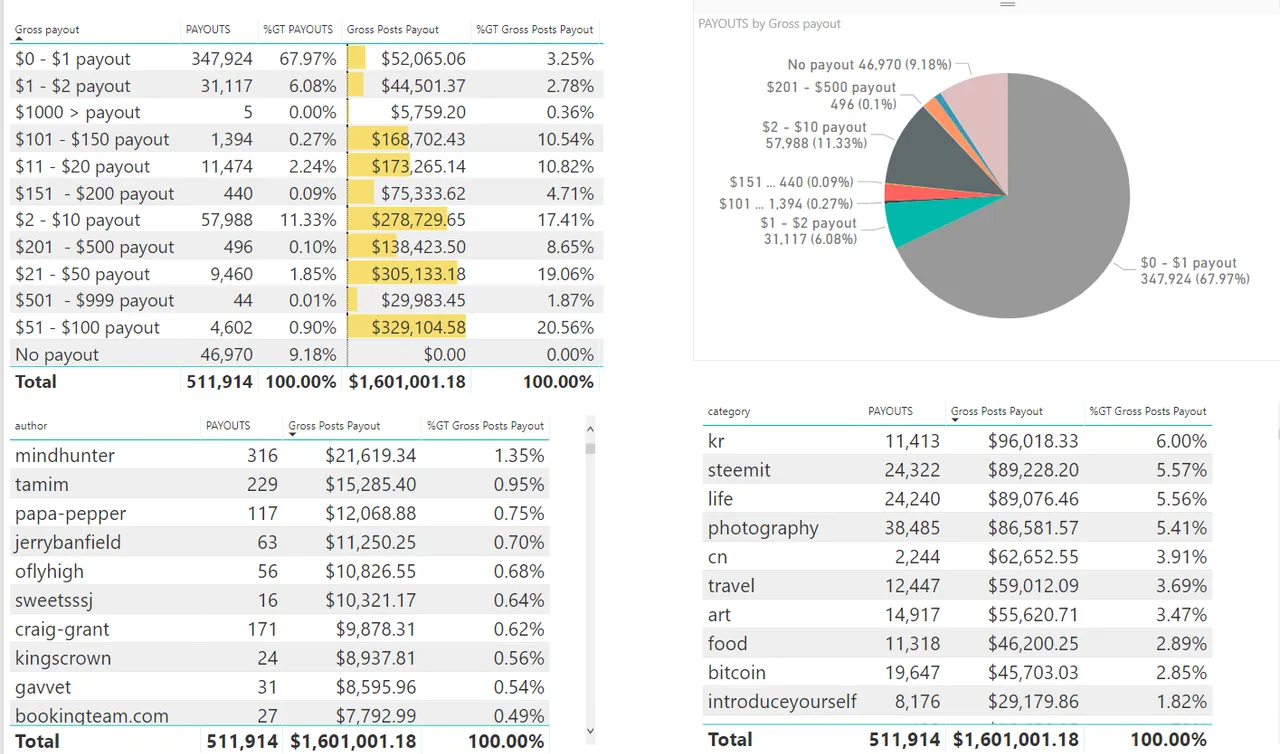
In July 18 the % of posts with no payout was almost 24%, up from 21% in June.
The % of posts with a payout of <$1is down from over 59% in June to a little over 56%
The number of posts with a payout of over $500 is down from 54 to 24
The average post pay-out value in July was $2.01 June was $2.08, May ’18 was $2.73. In April ’18 was $3.18. In March it was $1.76 SBD, $2.56 SBD in Feb and $3.81 SBD in Jan. If we exclude posts with no pay-out the average post pay-out increases to $2.64 SBD. In June the average post pay-out excluding post with no pay-out was $2.62 SBD.
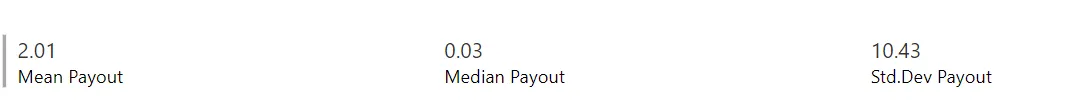
The median payout value was $0.03 with a standard deviation of 10.43
The number of posts decreased from June 18 to July 18 by 11%, and the pay-out value decreased by 14% for the same period.
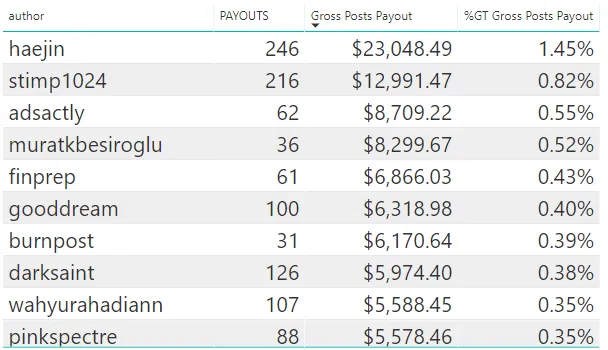
Top Authors based on Gross post payouts
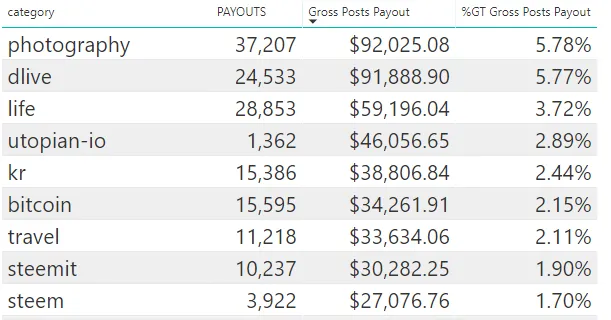
Top Category
2017
To get a quick comparison to the same time last year, here is last years report for July
We can see from this posts are up over 31% on the same time last year but the SBD value of the payments is down 32%. The stats for aug last year were:

Comments
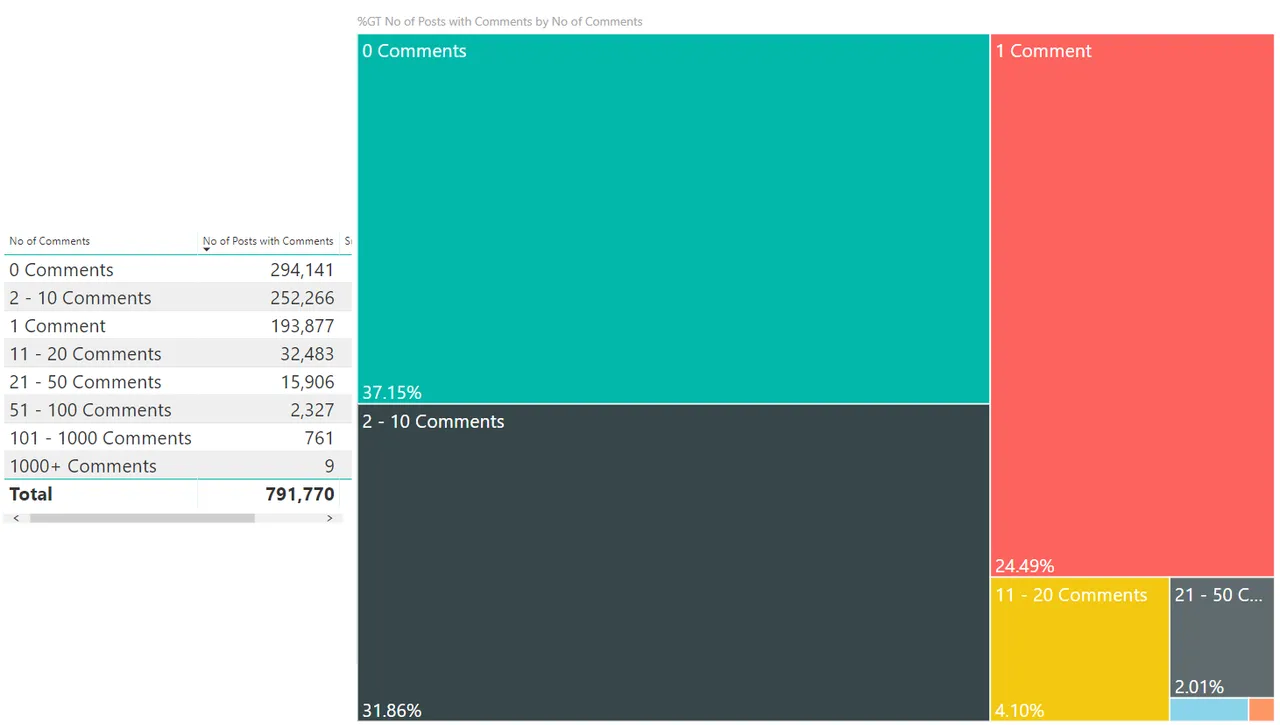
The % of posts with no comments is up from 34.29% in June to 37.15% in July.
The mean number of comments per post is 3.05, the median is 1 and the standard deviation is 11.3

Votes

The % of posts with 0 net votes has increased from 10.02% in June to 11.24% in July. The median votes per post was 5 with a standard deviation of 72.89.
Flags
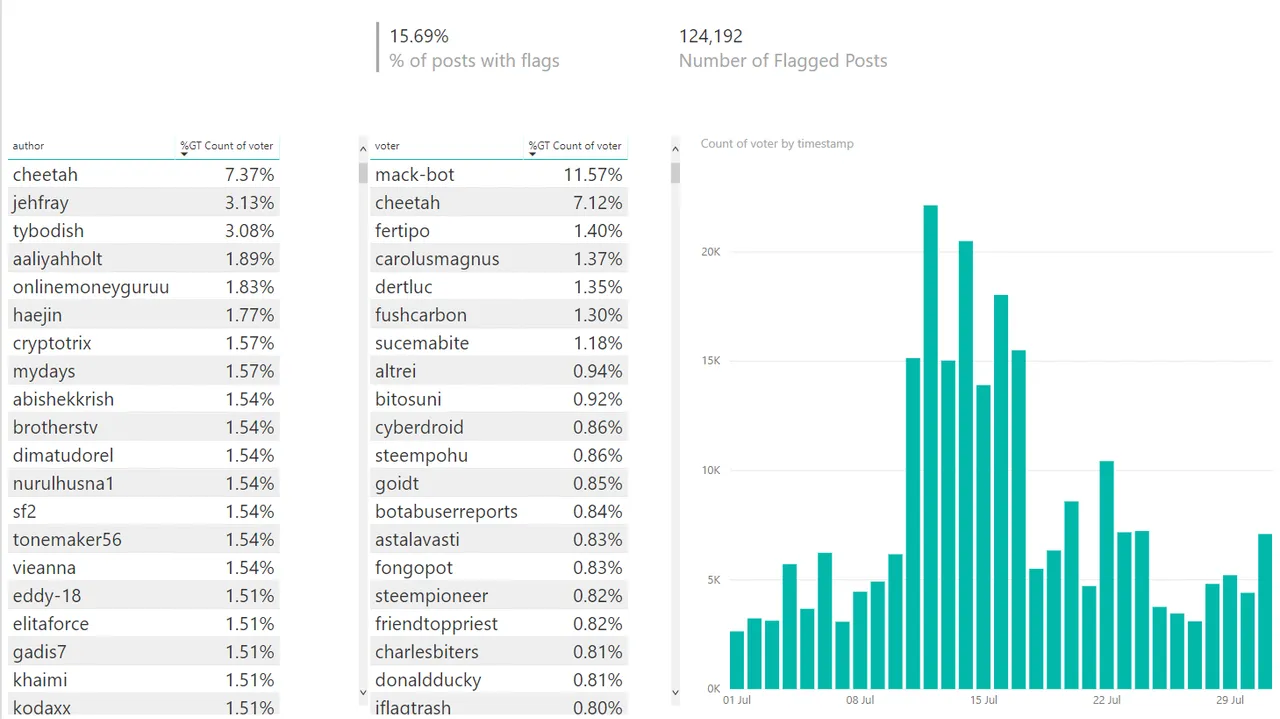
In votes above we also have flags, however combined only1.27% of posts had a net downvote. This is up from 0.82% the previous month.
124K posts received 1 or more flags( this is posts not comments). This makes up 15.69% of all posts made. This is up from 10.26% the previous month.
In the first table we can see the authors with the highest % of flags and after this the table shows who gave the most flags. Following this we can see the time series for when flags were given
Other Data
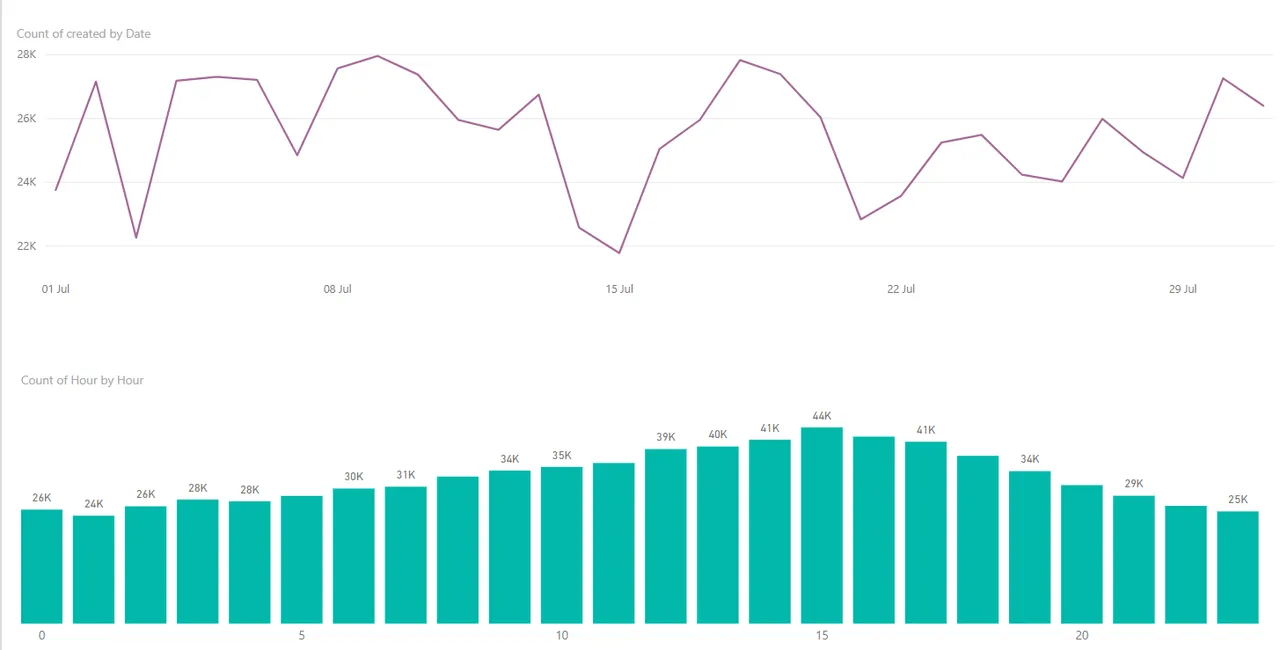
The line chart above represents the number of new posts per day in July 18 and the bar chart below that shows the peak posting hours.
August 19
Financial Performance
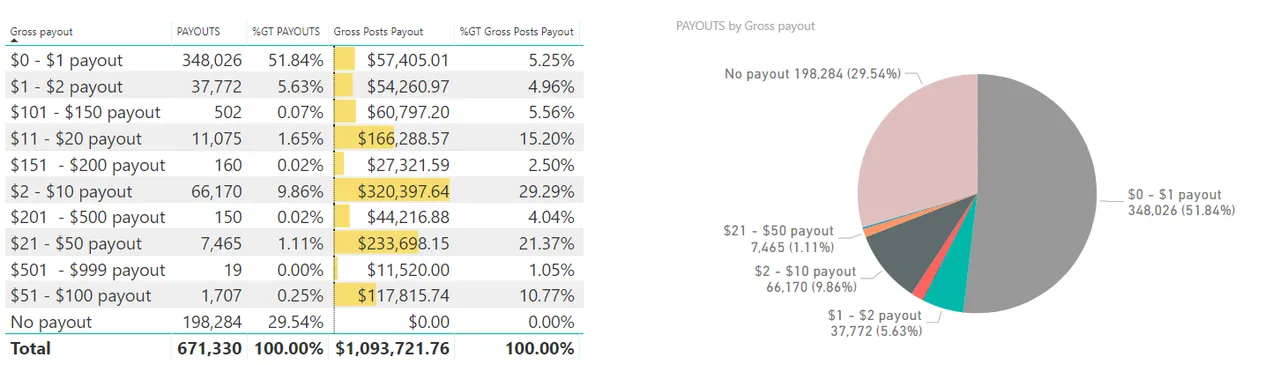
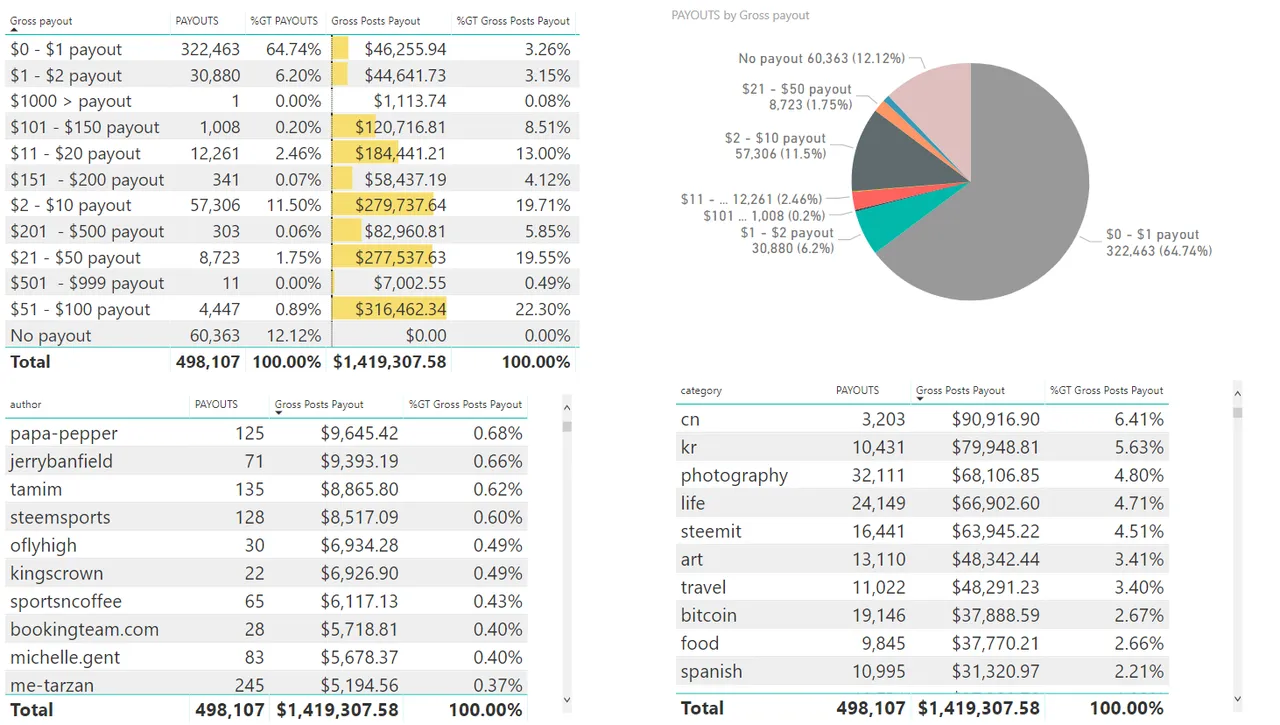
In August 18 the % of posts with no payout was just over 29%, up from 24% in July.
The % of posts with a payout of <$1is down from over 56% in July to a little under 26%
The number of posts with a payout of over $500 is down from 24 to 19
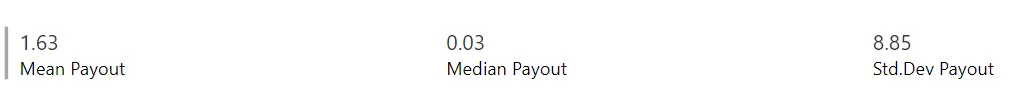
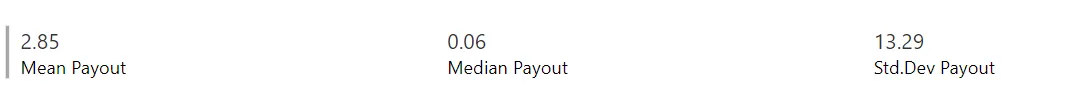
The average post pay-out value in August was $1.63. In July this was $2.01, June was $2.08, May ’18 was $2.73. In April ’18 was $3.18. In March it was $1.76 SBD, $2.56 SBD in Feb and $3.81 SBD in Jan. If we exclude posts with no pay-out the average post pay-out increases to $2.64 SBD. In June the average post pay-out excluding post with no pay-out was $2.62 SBD.
The median payout value was $0.03 with a standard deviation of 8.85
The number of posts decreased from July 18 to Aug 18 by 15%, and the pay-out value decreased by 31% for the same period.
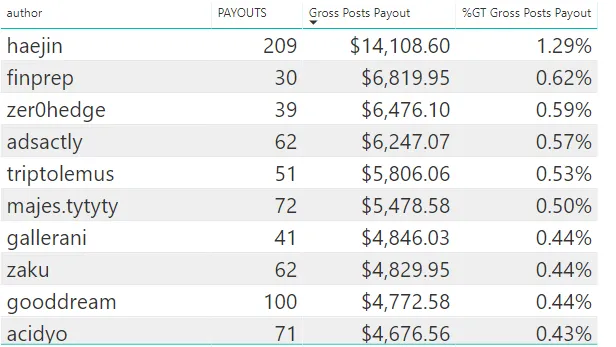
Top Authors based on Gross post payouts
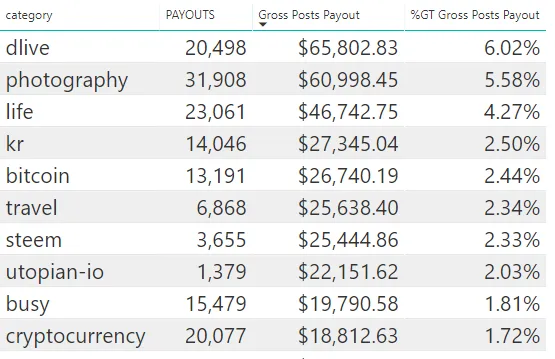
Top Category
2017
To get a quick comparison to the same time last year, here is last years report for August
We can see from this posts are up over 50% on the same time last year but the SBD value of the payments is only up 12%. The stats for aug last year were:
Comments

The % of posts with no comments is up from 37.15% in July to 38.43% in Aug.
The mean number of comments per post is 3.17, the median is 1 and the standard deviation is 38.47
Votes
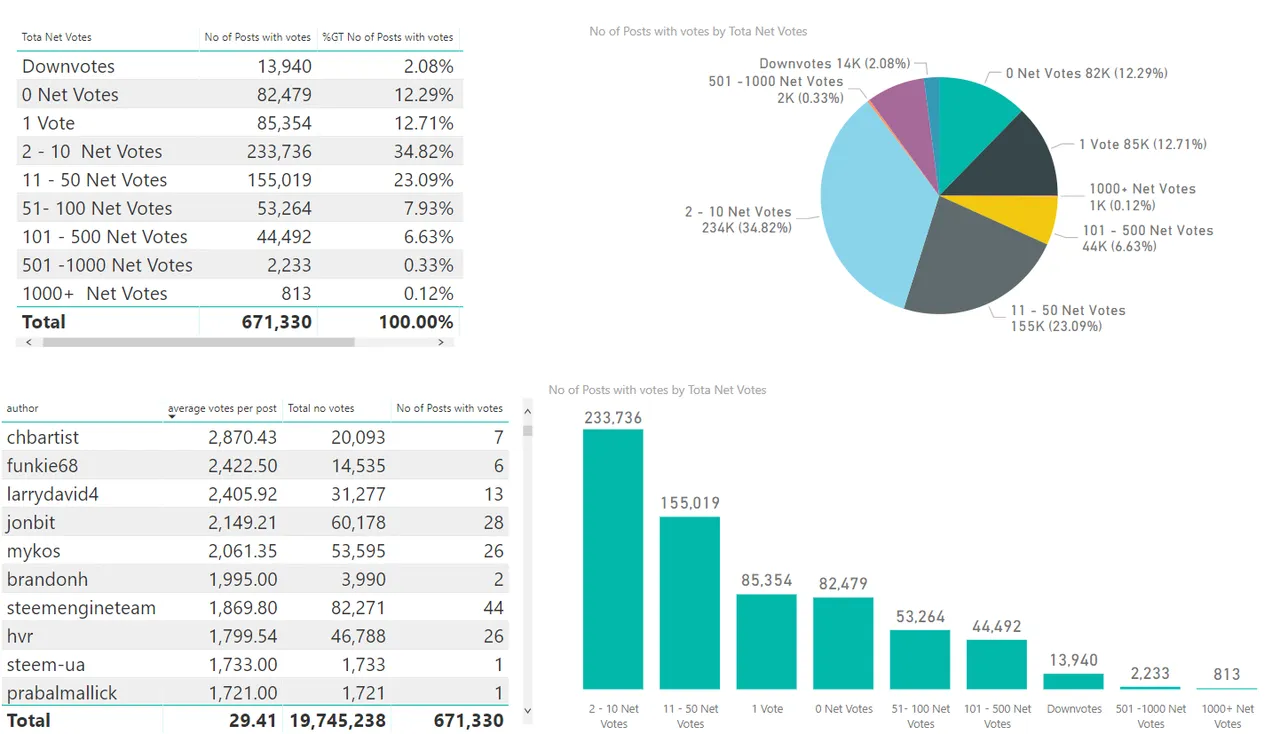
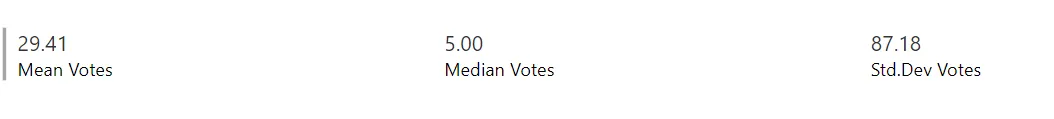
The % of posts with 0 net votes has increased from 11.24% in July to 12.29% in Aug. The median votes per post was 5 with a standard deviation of 87.18.
Flags
In votes above we also have flags, however combined only1.27% of posts had a net downvote. This is up from 0.82% the previous month.
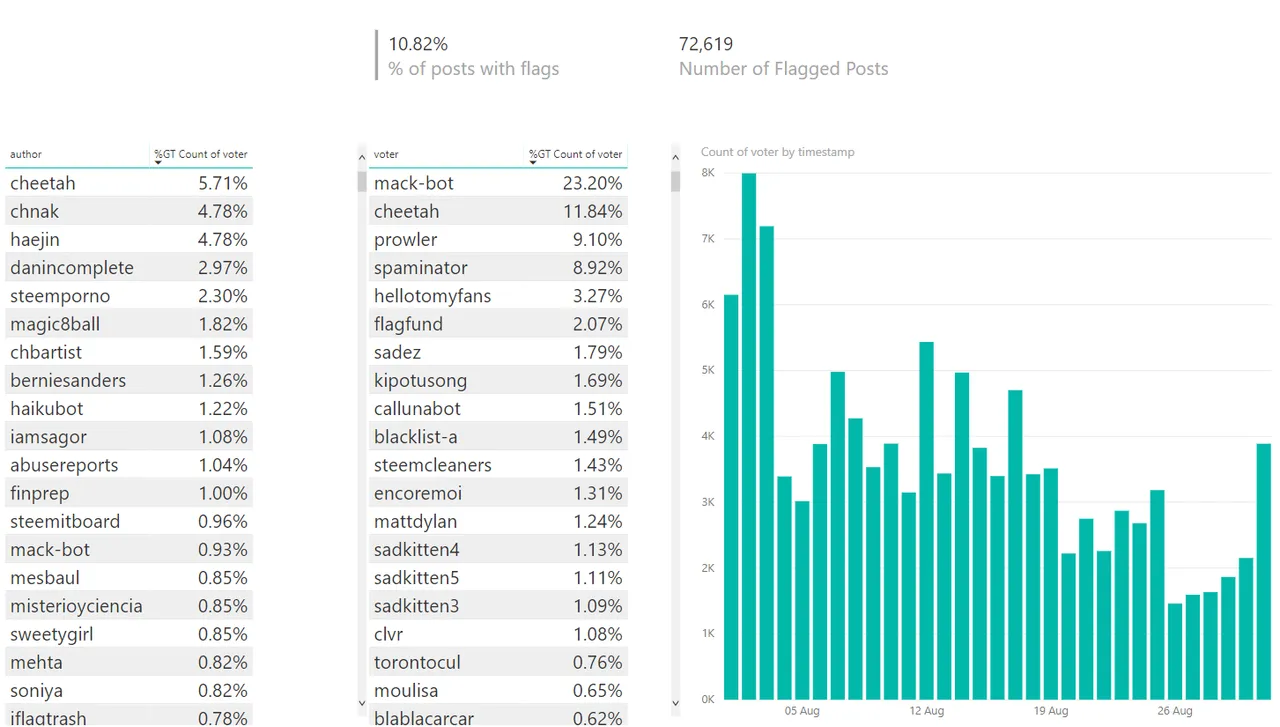
72K posts received 1 or more flags (this is posts not comments). This makes up 10.82% of all posts made. This is down from 15.69% the previous month.
In the first table we can see the authors with the highest % of flags and after this the table shows who gave the most flags. Following this we can see the time series for when flags were given
Other Data
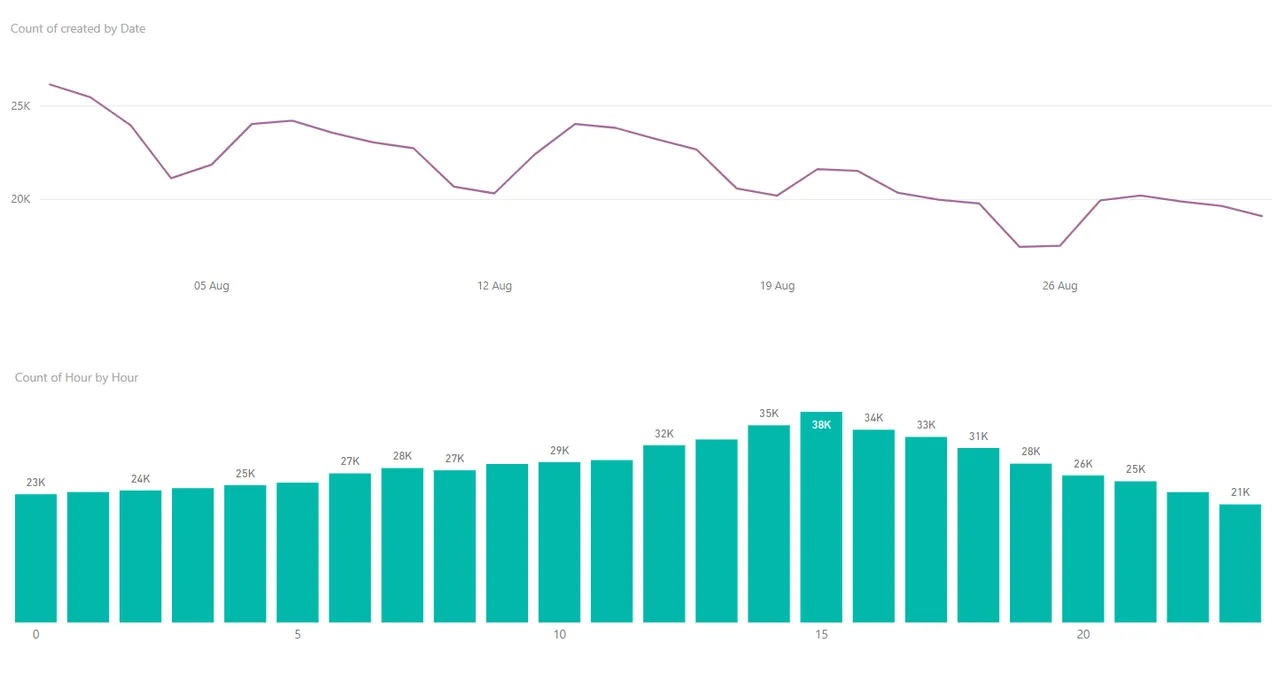
The line chart above represents the number of new posts per day in August 18 and the bar chart below that shows the peak posting hours.
Conclusion
Post payouts have been on a downtrend for some time now. The price of SBD and STEEM have an impact on this and we are seeing a difficult year for crypto in general which is having its toll on post payouts.
The number of posts made per month has also been on a downtrend for much of this year and July and Aug are just following the trend. However if you look at the number of posts made the same time last year, there is still a substantial increase.
The median votes per post has remained consistent at 5 in July and Aug for both 2017 and 2018 however the median number of comment per post has reduced from 2 to 1.
The Data source and Query
As always I have connected to Steemsql managed by @arcange using Power BI and the query is usedfor 2018 data was
SELECT author, category, created, children, total_payout_value, net_votes, pending_payout_value FROM Comments (NOLOCK) where created >= CONVERT(DATE,'2018-07-01') and created< CONVERT(DATE,'2018-08-01') and depth = 0And 2017 query was
SELECT author, category, created, children, total_payout_value, net_votes, pending_payout_value FROM Comments (NOLOCK) where created >= CONVERT(DATE,'2017-07-01') and created< CONVERT(DATE,'2017-09-01') and depth = 0