Coin Market Cap - Finding The Data You Need
I searched far and wide for the Circulation Supply on SBD and could not find a site that supply this information. Digging into Coin Market Cap gave a part of what's required to determine it and with a bit of number crunching, low and behold. Below is a part of the information you want to look at when buying or holding on to SBD.
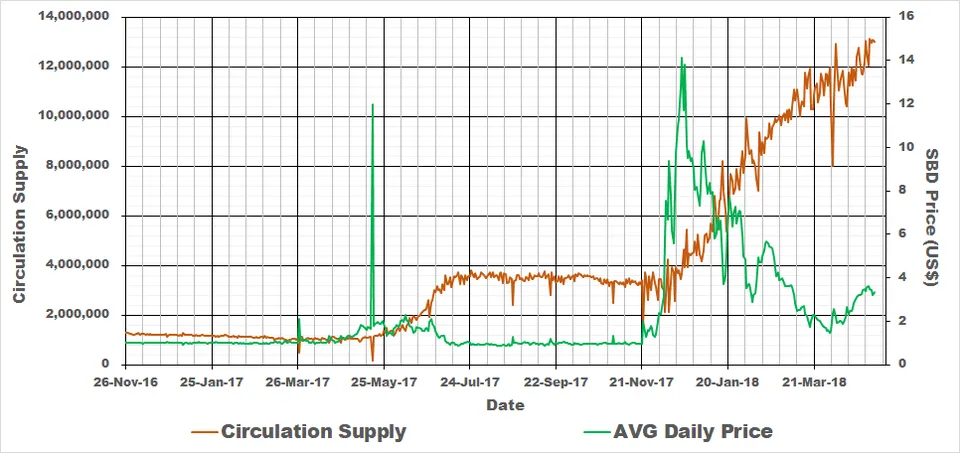
Need I Say More?
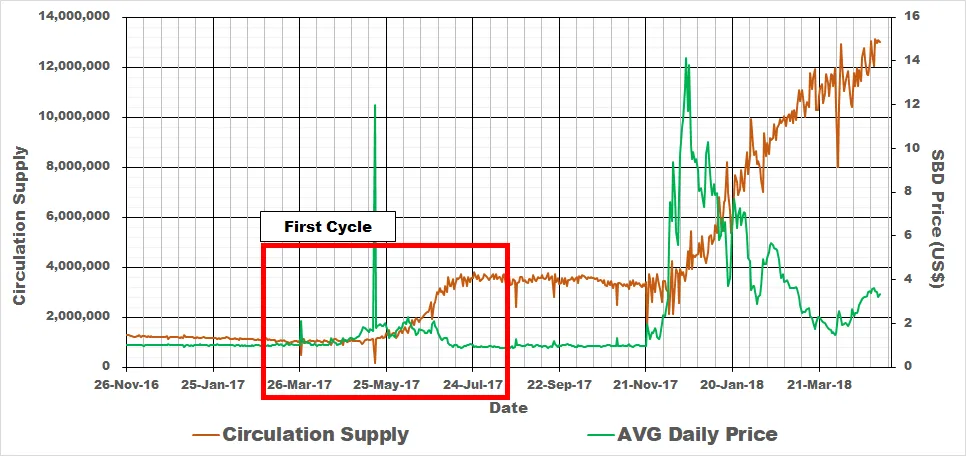
Cycle One
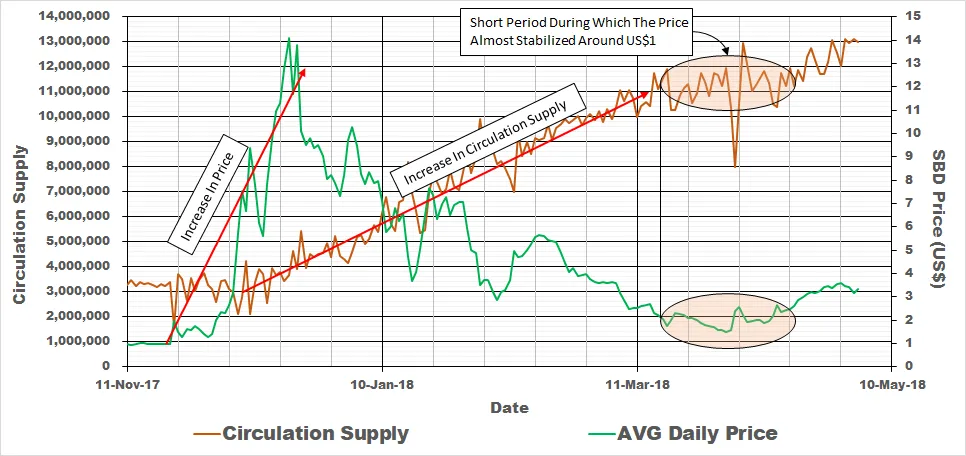
We can clearly see the first cycle of SBD during which a price increase (*due to an increase in demand, hence increased market capitalization) leads to an increase in circulation.
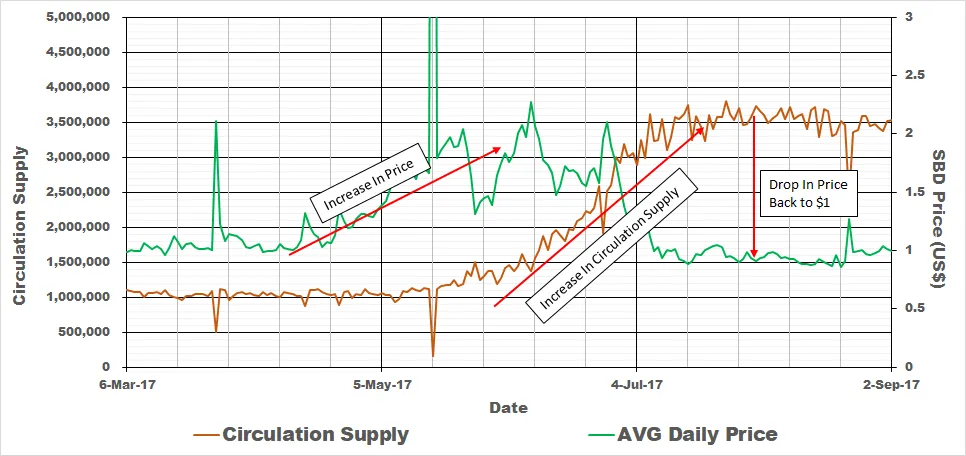
Looking at the blown up graph of the above highlighted timeline it is clear what an increase in circulation supply does to the price. The price settles around US$1 after circulation supply average out at approximately 3.5 million coins. From the initial circulation supply of around 1.0 million coins this is a 350% increase in the circulation supply of SBD coins to pull down the price.
Second Cycle
We are currently in the second cycle as highlighted in the below graph. It is clear that we are at a record high in SBD coins in circulation.
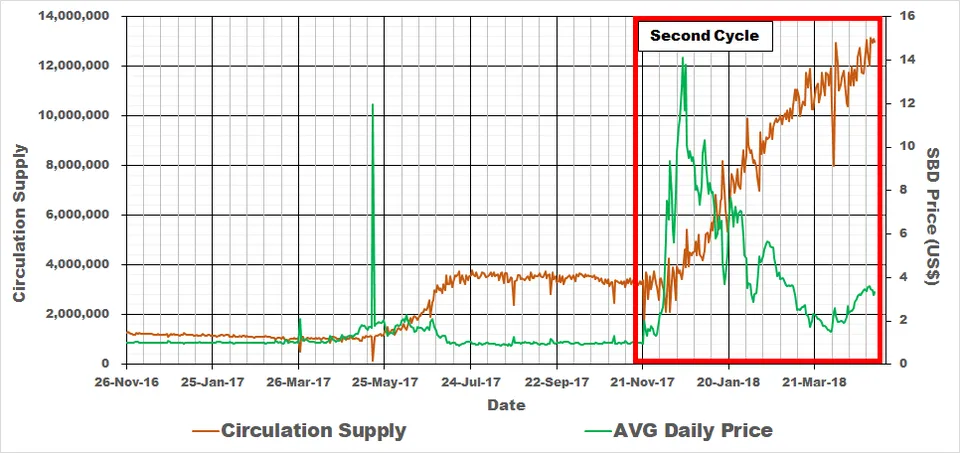
Blowing up the timeline highlighted in the above graph shows the trend. Circulation supply continues to increase as the price of SBD is forced to US$1. Currently circulation supply is almost 13.0 million coins which is a 1300% increase in coins since the start of the first cycle.
Additional Information
SBD Coin Market Cap Data
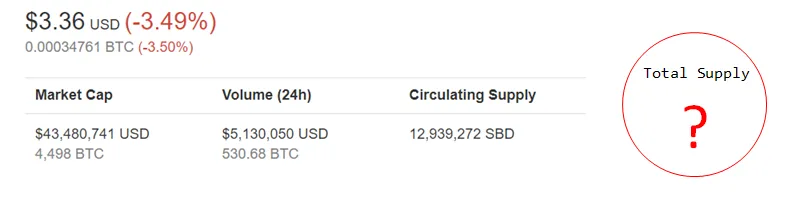
When I looked at data on Coin Market Cap for SBD the first time, I was confused as to why there is no Total Supply Data. This gives an indication on how much the coin will be devalued over a specific period (refer to below image).
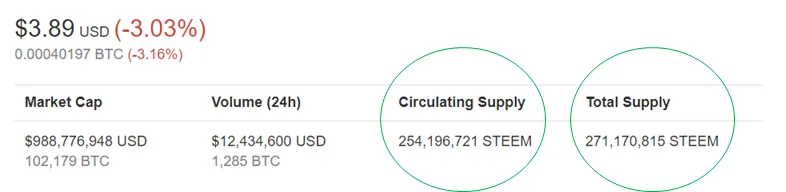
For Steem this information is provided as seen below.
It is clear that the Circulation Supply for SBD provided by Coin Market Cap, is the current coins in circulation, with no total indicated. This can be monitored for an indication in the increase in coins in circulation. Circulation supply for SBD that was indicated on Coin Market Cap at the start of the first cycle (as explained above) was approximately 1.0 million coins.
Calculating SBD Circulation Supply
- Step 1 - See https://coinmarketcap.com/currencies/steem-dollars/historical-data/
- Step 2 - Select All Time Data as seen below
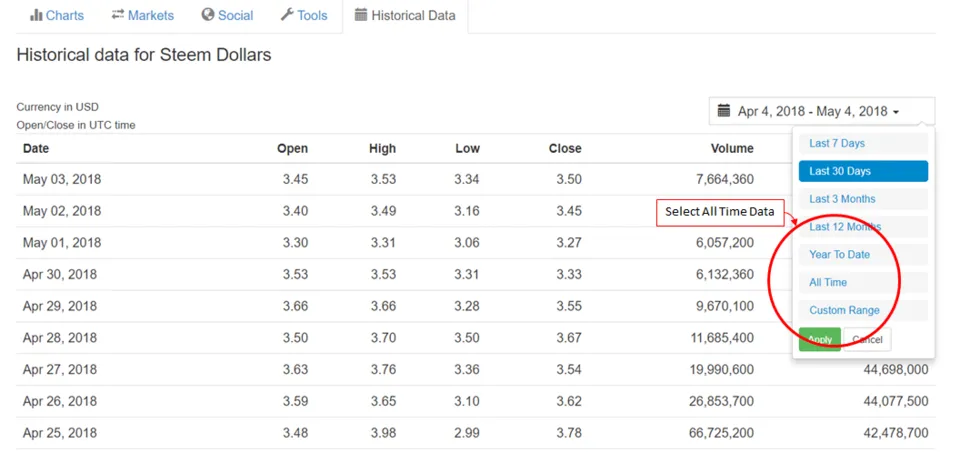
- Step 3 - Copy data to excel, average out "High" and "Low" SBD Price
- Step 4 - Determine Circulation Supply & Sketch Price and Circulation Supply
Steem Circulation Supply
@booster916 was kind enough to provide the following explanation on Steem Circulation Supply Increase:
"The rate that new tokens are generated was set to 9.5% per year starting in December 2016, and decreases at a rate of 0.01% every 250,000 blocks, or about 0.5% per year. The inflation will continue decreasing at this rate until it reaches 0.95%, after a period of approximately 20.5 years."
Conclusion
Although SBD is being devalued at a very high rate there is still a small amount of SBD coins in Circulation and a small change in the market can lead to price surges as witnessed in December 2017. This might be different in the future because of the extreme rate at which coins are being printed. SBD at US$1 seems to be the best time during which to buy and hold for a potential profit as witnessed during December 2017 when the price jumped from US$1 to more than US$15. Another advantage of buying at US$1 is that it cannot fall to much lower than US$1 because SBD will always be exchangeable for steem at US$1.
Image/Data Source

Consider donating should this post have been of value:
BTC - 18atWSWrN2bDxNWeoc3Q68coQBEk69FvUY
ETH - 0x71844057eec156843af64b2b8021daf3615b0e06
LTC - LPji8igXQ1cqjhZDFZUYgEWvVshGVi4AA1