
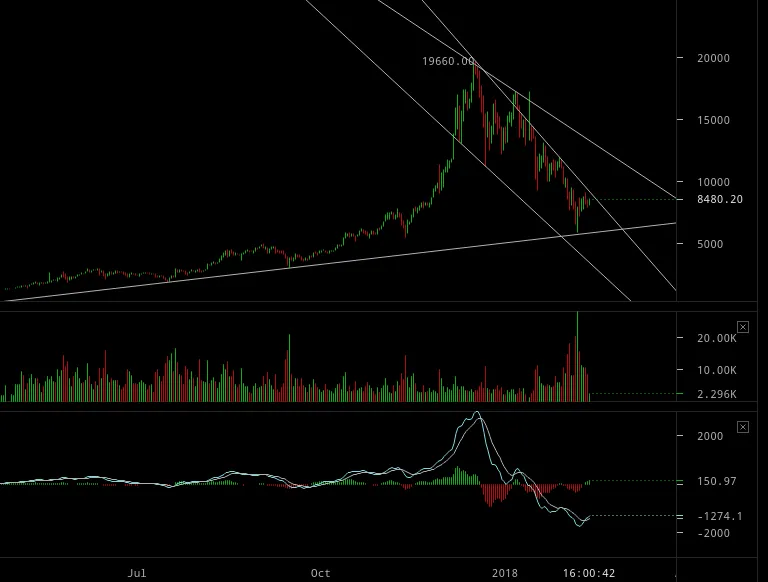
My interpretation is that if we don’t break up out of the (what is normally eventually a bullish chart pattern) declining wedge now, then crash imminent, but more likely we break out up to the overhead white line resistance which ranges from $9 – $13k (from whence the crash could proceed towards $3500 or $1275), depending how quickly we bounce to up there:
click to enlarge
So then if we do break out up over the middle declining white line, then we’re in a bearish funnel (megaphone) pattern and that said middle line could become support on the crash, so that projects to $3500 by mid-march and $1275 by end of March. This seems to perhaps coincide with potential timings for the bottom of the DJIA in his new $750 2018 Share Market Report entitled “NYSE - Boom or Bust?”. Note I haven’t read that report, but will do so within next 24 hours or so.
The analysis in Bullish Signals Above $8K, But Has Bitcoin Turned the Corner? is congruent with my interpretation.
Also others such as How bitcoin's plunge may have been a precursor to market turmoil are noticing the correlation of all risks assets taking a dive at this juncture.
RE: POSSIBLE SLINGSHOT BITCOIN CRASH AHEAD