
Well f*ck me. I was looking at the default logarithmic view at 99bitcoins which displays “2019-01-01 $4177.35”, because at that time cryptowat.ch was crashing on the old version of my Chrome browser on Linux Mint Mate. I have installed an “unstable” newest version of Chrome (only other choice available on my older revision of Mint Mate) and now I can see you are correct.
So according to Armstrong’s computer system, the BTC prices is headed to $775! No wonder he is gloating so much about Bitcoin being not capable of having any significant impact.
I don’t know whether to trust his system, but this does cause me to think very carefully about planning.
SUBJECT: Armstrong is employing scare tactics
We can clearly see on the following chart that it’s more or less impossible for BTC to decline below $1200 without ending the adoption of Bitcoin:
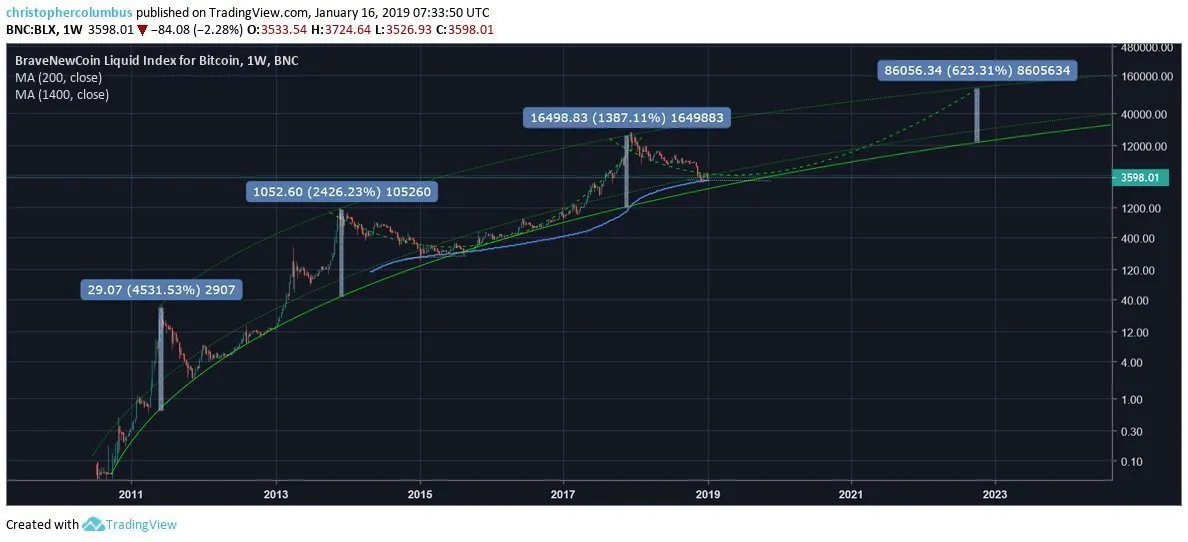
The only way that happens is if Bitcoin is somehow broken. Maybe the postulated SegWit theft is the only way I can see that happening. And I do not expect that theft until Lightning Networks is ubiquitously adopted, which would mean a much higher BTC price first.
His Socrates systems provides reversals and ranges. The $775 is an extreme of the possible range is probably only about a 1-in-1000 probability. Armstrong is being disingenuous here and using scare tactics so he can gloat about the Bitcoin bear market correction.
No fucking way the BTC price is going back to $775.
We may have some more downside into the $2500 to $3000 range, but hell no on below $1000. A small probability of dipping below $1500 on this bear market, but that is not likely.
RE: Most Important Bitcoin Chart Ever