
Repo
https://github.com/pzhaonet/steemr
Brief Intro and curriculum
'steemr' is an open source R package for playing with Steem data in R environment. It is used to download, post process, analyze, and visualize Steem data on the basis of the powerful statistic power of R.
Previously on steemr:
- [New Project] steemr: an R package to download, play with, and visualize Steem data
- [New Features on steemr] Now steemr supports SteemSQL queries!
- [New Features on steemr] supports AppBase API and plots active hour diagrams!
- [New Features on steemr] Functions as vote reports!
- [New Features on steemr] Functions for accounts and comments report!
- [New Features on steemr] Functions for saving the posts and building an independent blog site!
- [New Features on steemr] Functions for delegation report and CNer report!
- [New Features on steemr] Functions for a user friendly UI as a follower report!
New Features
What features did I add?
A comment by the utopian.io moderator mentioned that the wordings of both 'followers but not following', 'following but not followers' are confusing. Although they are the official callings that I cannot change, a diagram could help. Therefore, I added a Venn diagram into the sfollow()shiny app.
A Venn diagram shows all possible logical relations between a finite collection of different sets. It is usually a diagram which consists of multiple overlapping circles, each representing a set. In a Venn diagram of the follower report, the pink area indicates the number of the steemians who follow the given ID (followers), the blue the number of those who are followed by the given ID, and the purple the intersection. The figure below shows the Venn diagram of a certain ID.
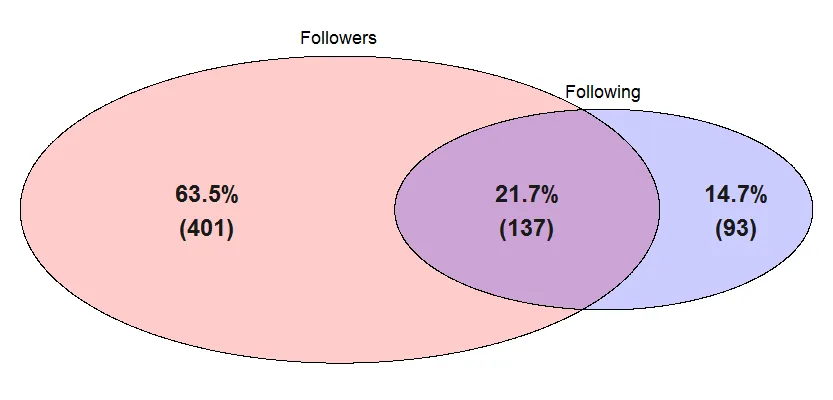
Figure 1. Guess whose Venn diagram is this.
Besides, I also added three wordcloud diagrams to display the levels of the followers ranked by the follower number, post number, and vests. By moving the sliders, users can choose the top n followers displayed.
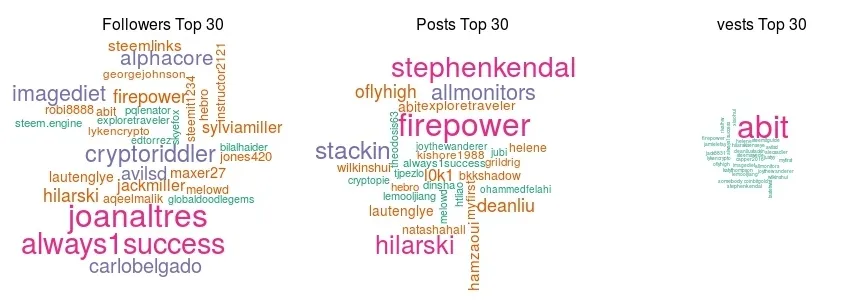
Figure 2. Wordclouds of the follower levels.
How did I implement them?
I added some user interface elements, including sliders, diagrams, and explanation texts, into the internal functions sfollow_ui() and sfollow_server() which are the UI function and server function for sfollow(). Each part of the functions are well documented. Other files were updated automatically by compilation.
Link to relevant lines in the code on GitHub can be found mainly in my latest commit (click to see the details):