
Introduction
A full node server is necessary to receive and broadcast blockchain data. There are API-calls for most use cases:
- receiving the newest posts for a feed of a specific user
- show who already voted for a post
- show the latest transfers of a user
- receiving the operation from the last 10 blocks
- broadcasting an operation to the blockchain (e.g. for posting, voting, ...)
- ...
All these information are organized in databases inside the full node. These databases are needing a lot of RAM, which makes them very expensive. Each server unit can handle only a limited number of responses per second. When the number of calls per second is higher than the server can handle, the delay time for each response will increase until the server breaks down. This report tries to measure the current state of all available full nodes.
Over the last 30 days, a benchmark was performed every 3 hours on all available full nodes. The results of these benchmarks are stored as account update in @fullnodeupdate. The following parameters were measured:
- Blocks per second - It was measured how many blocks could be streamed in 30 seconds.
- Api call duration - The mean duration of receiving a vote, a comment, and an account is measured in seconds
- Account history operation per second - It was measured how many account history operation could be streamed in 30 seconds
- Irreversible block time delay in seconds- The time difference of the latest irreversible block that the node returns to the newest block is measured
Available full nodes
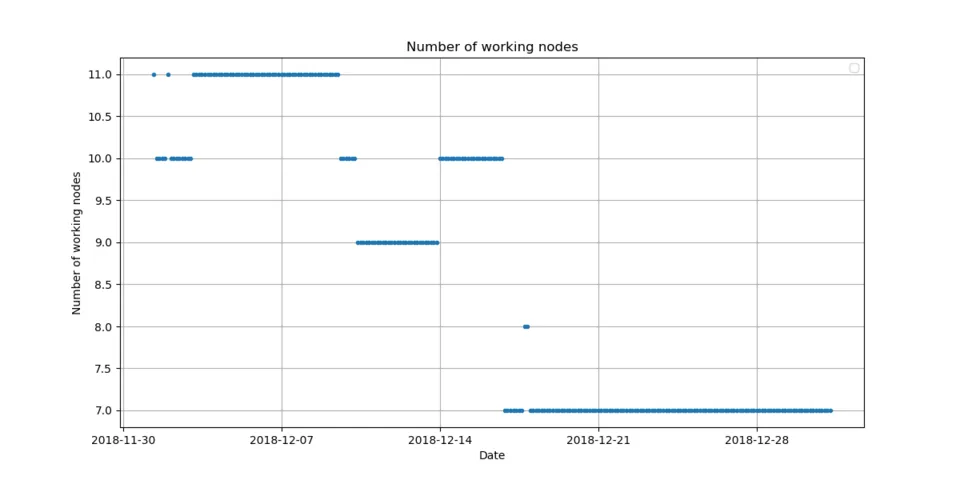
The number of available full nodes is declining from 11 to currently only 7. Disabled nodes are:
- rpc.buildteam.io - post about going offline
- rpc.steemliberator.com is currently not working (https issue?)
- The websocket from rpc.curiesteem.com was disabled, I will switch to the https interface.
https://steemd.minnowsupportproject.org
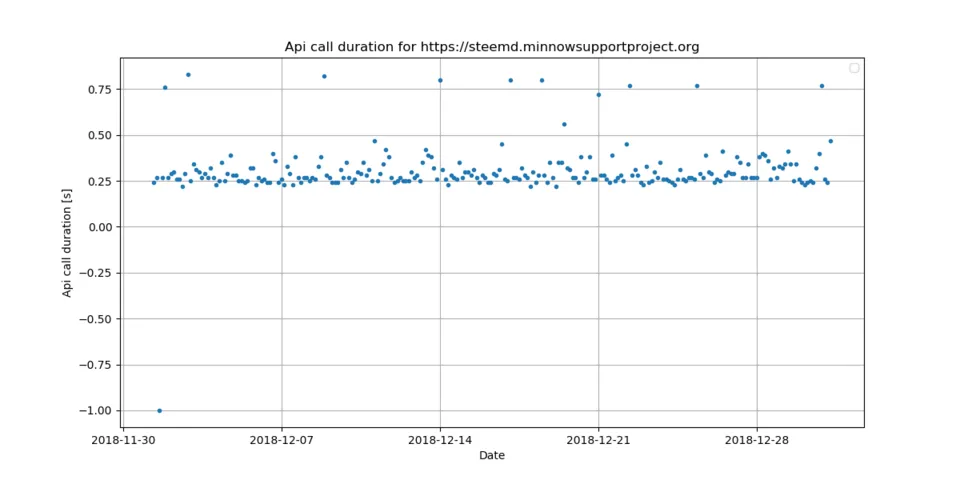

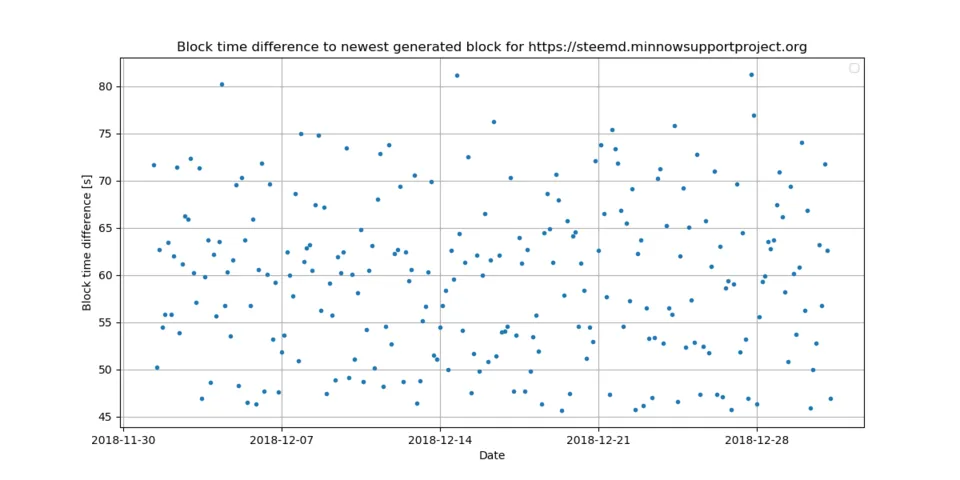
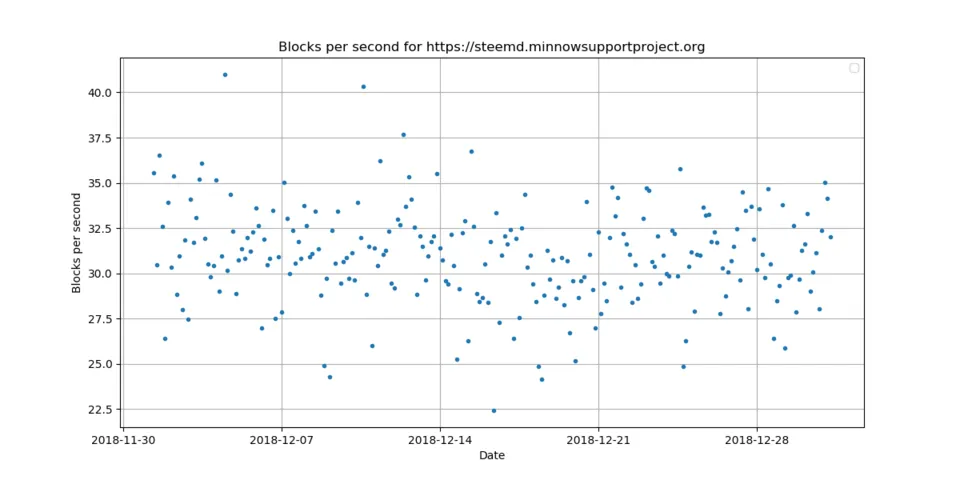
The https://steemd.minnowsupportproject.org node has a good performance. It handles around 2563 history operation per second, 31 blocks per second and needs 0.31 seconds for an API call. The block delay is around 46 - 81 seconds.
https://anyx.io
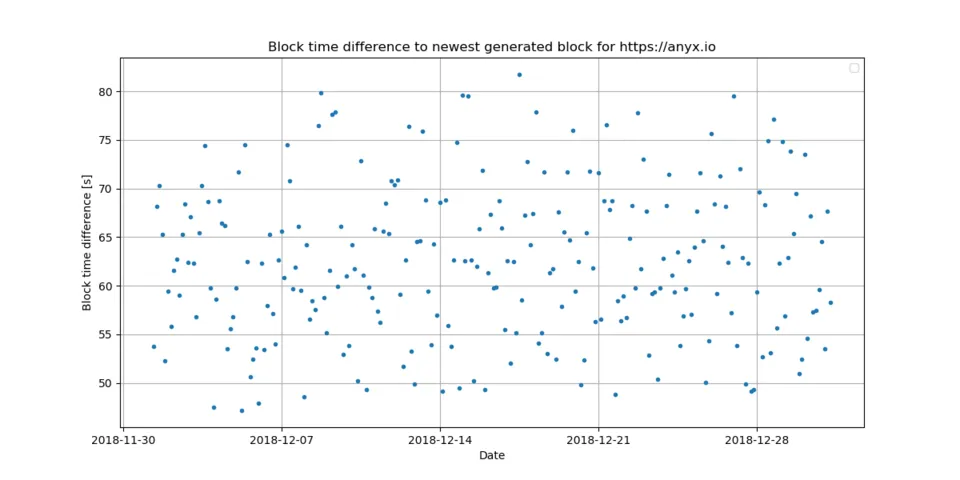
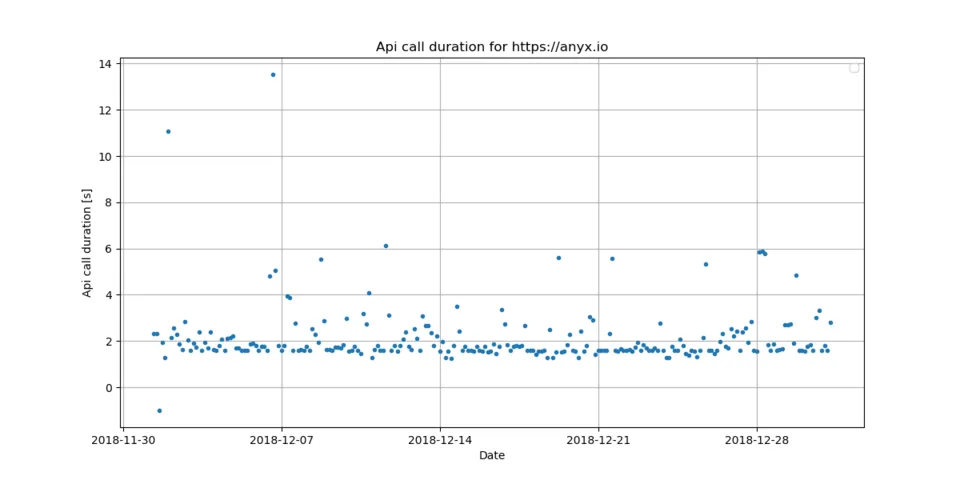
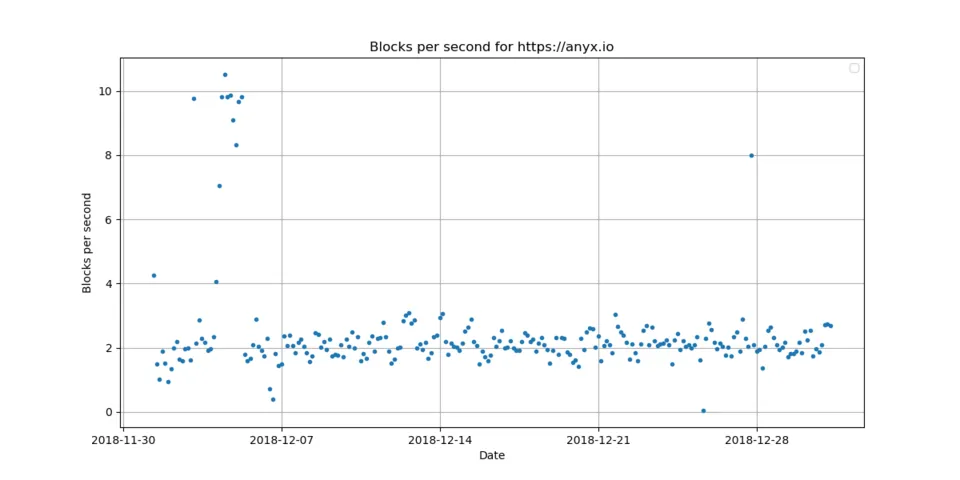
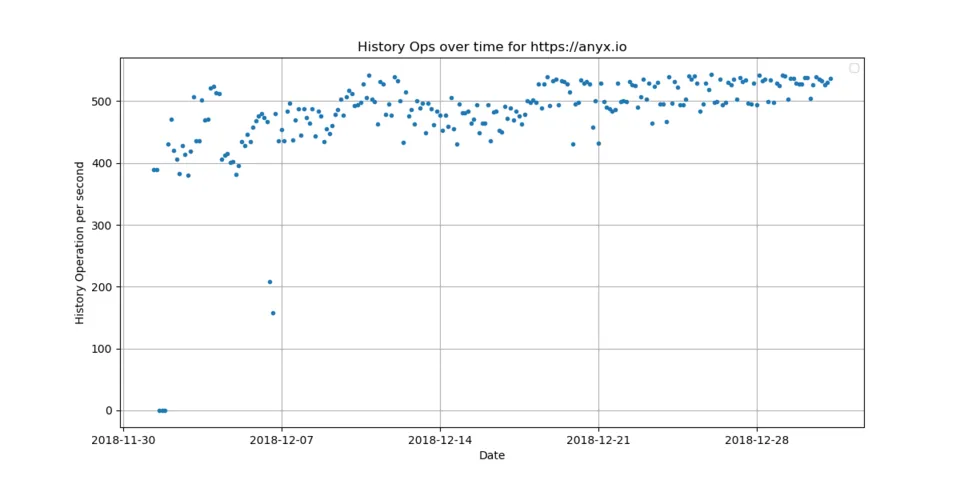
The https://anyx.io node has a good performance. It handles around 481 history operation per second, 2 blocks per second and needs 2.14 seconds for an API call. The block delay is around 47 - 82 seconds.
https://api.steemit.com
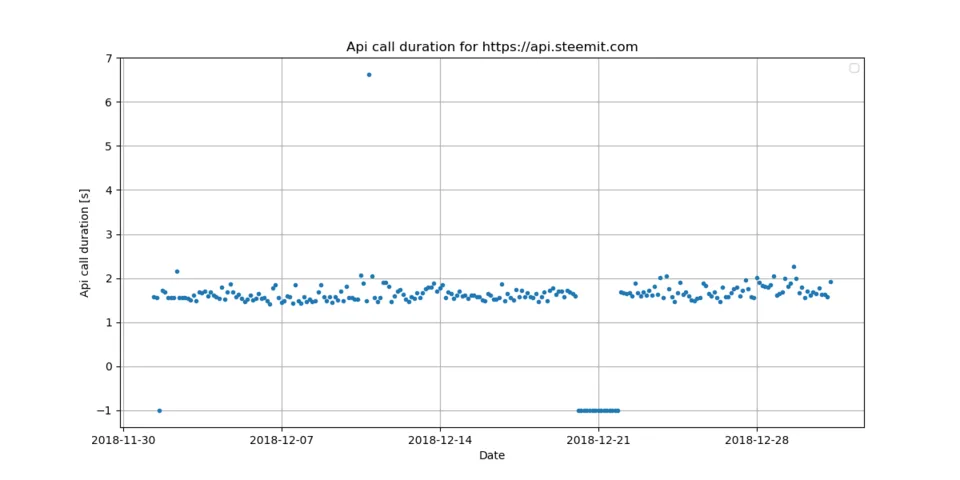
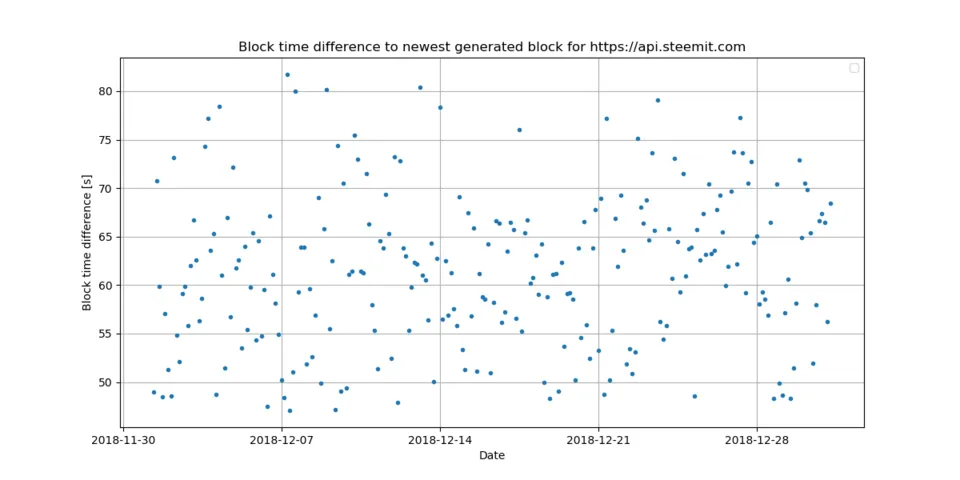
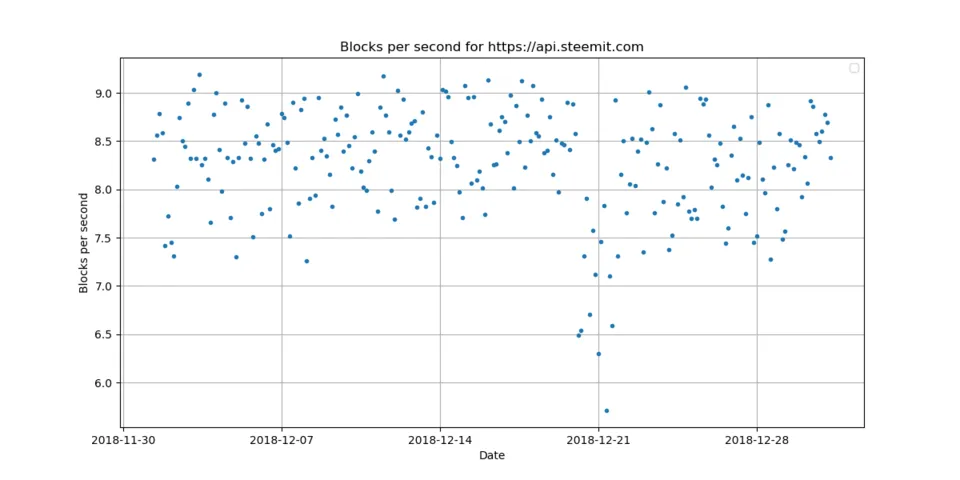
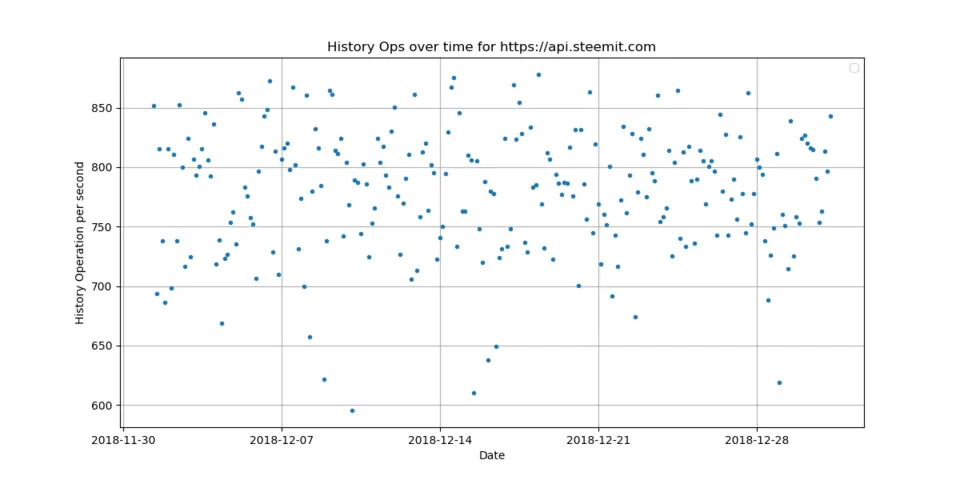
The https://api.steemit.com node has a good performance. It handles around 780 history operation per second, 8 blocks per second and needs 1.50 seconds for an API call. The block delay is around 47 - 82 seconds.
https://api.steem.house
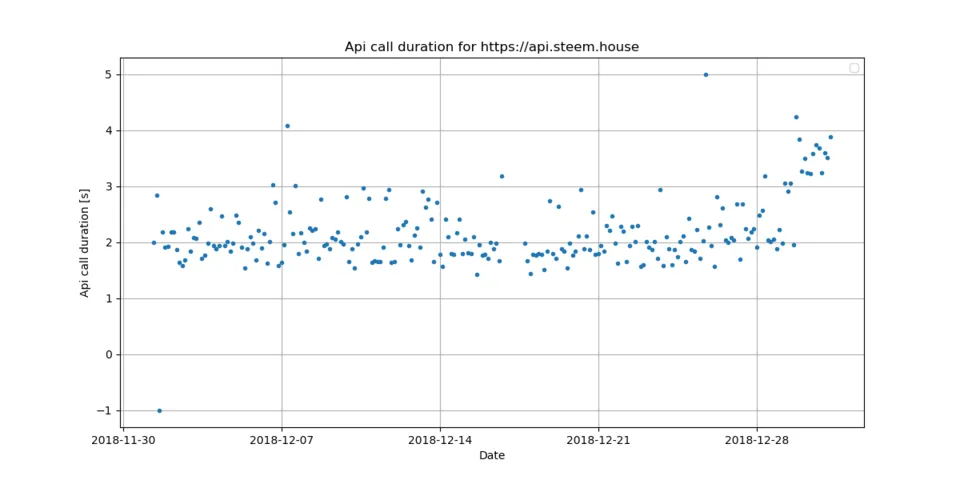
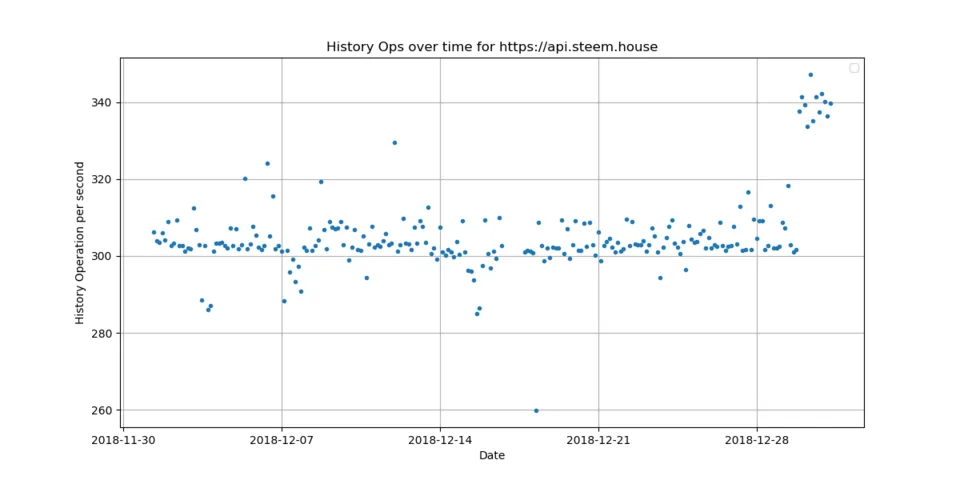
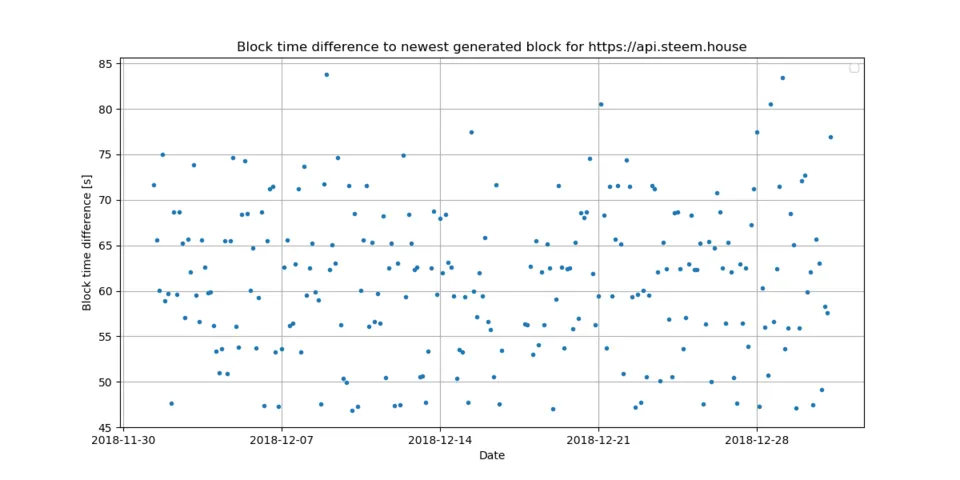
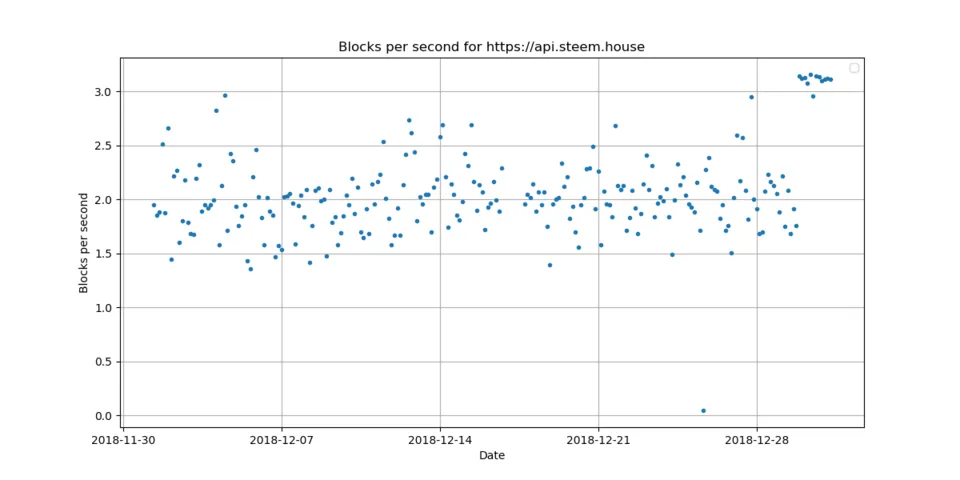
The https://api.steem.house node has a good performance. It handles around 305 history operation per second, 2 blocks per second and needs 2.16 seconds for an API call. The block delay is around 47 - 84 seconds.
https://rpc.steemviz.com
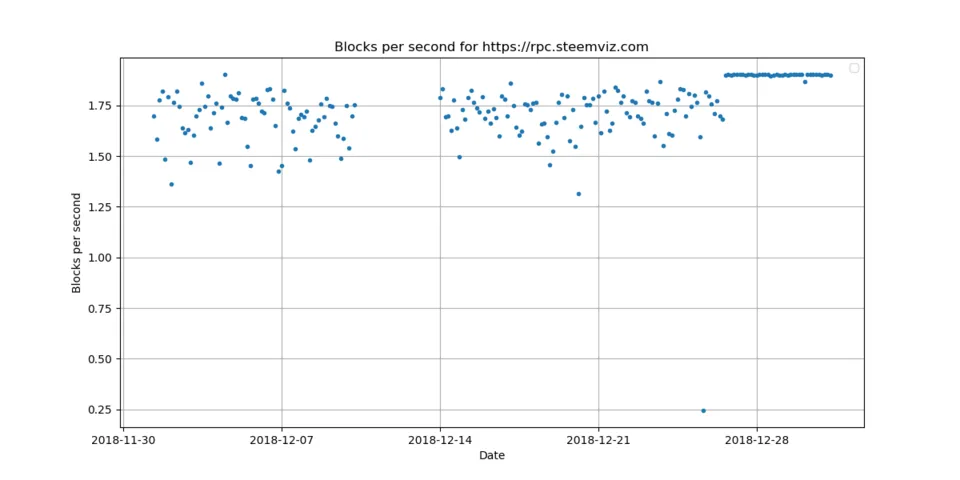
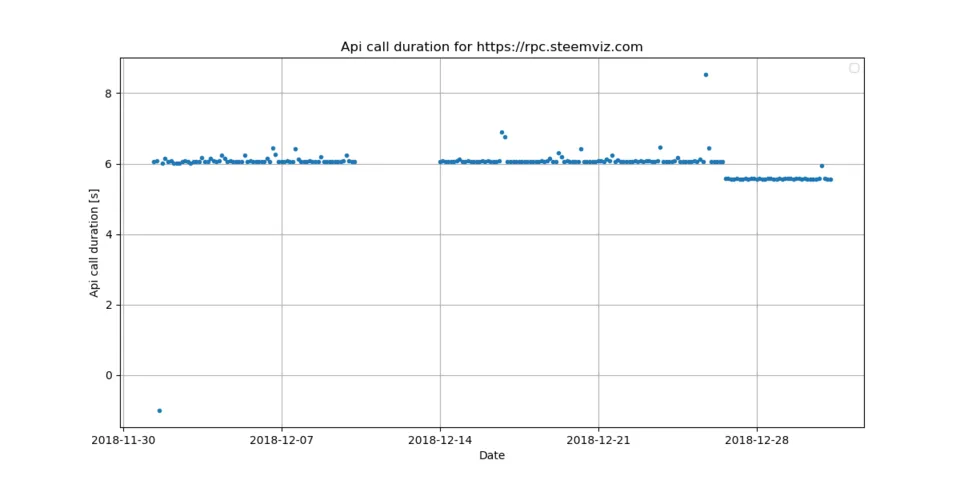
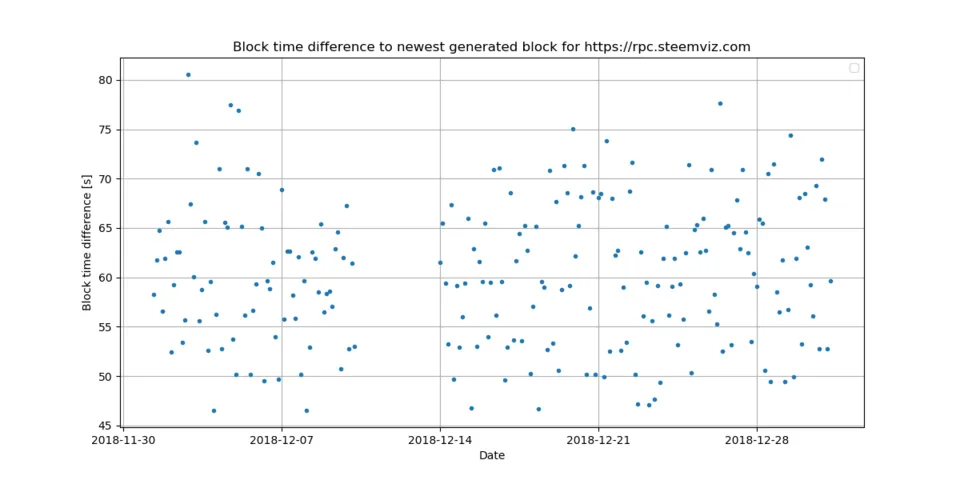
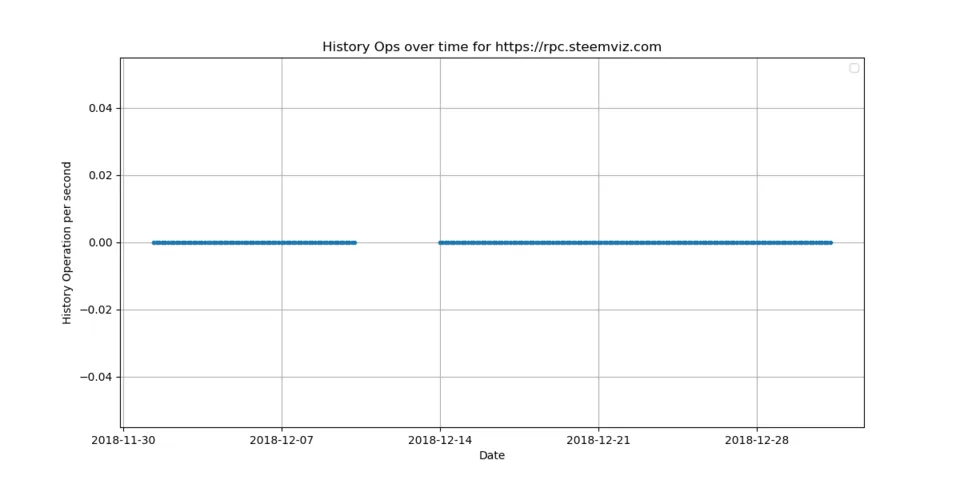
The https://rpc.steemviz.com node has a good performance. It handles around 0 history operation per second, 2 blocks per second and needs 5.98 seconds for an API call. The block delay is around 47 - 81 seconds.
https://appbasetest.timcliff.com
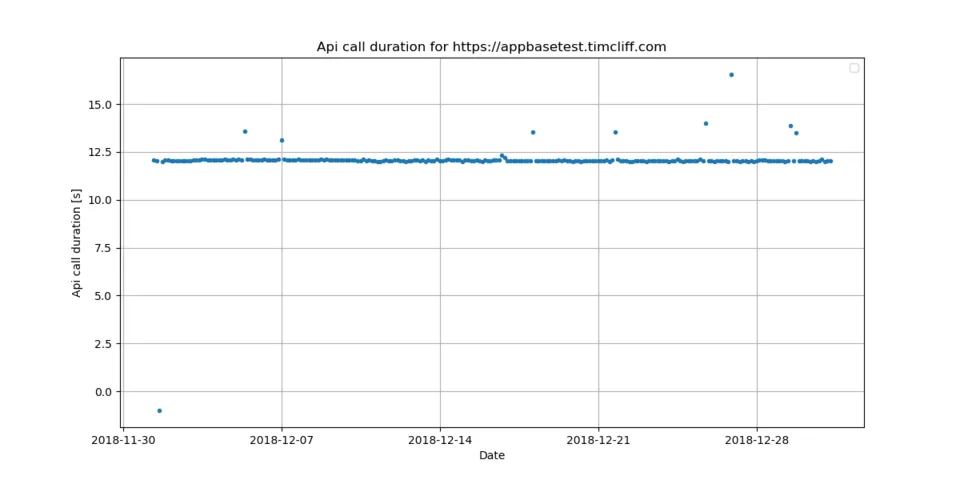
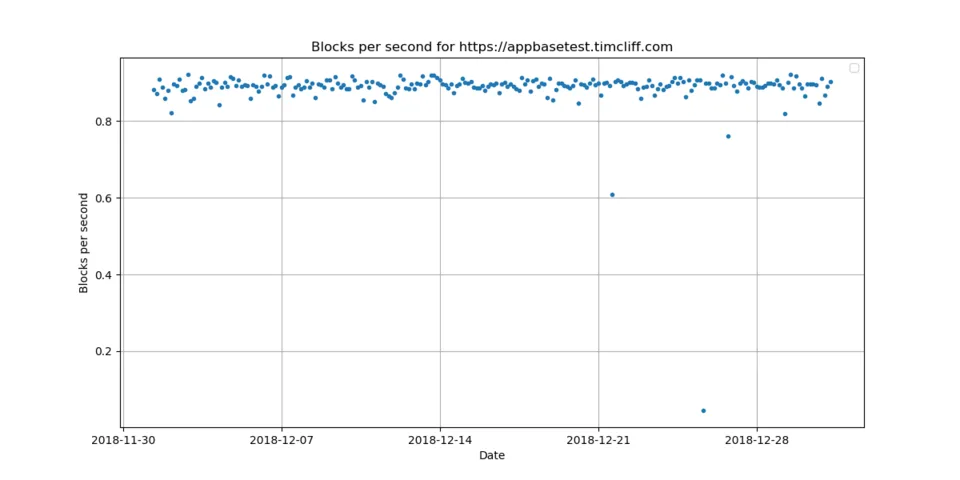
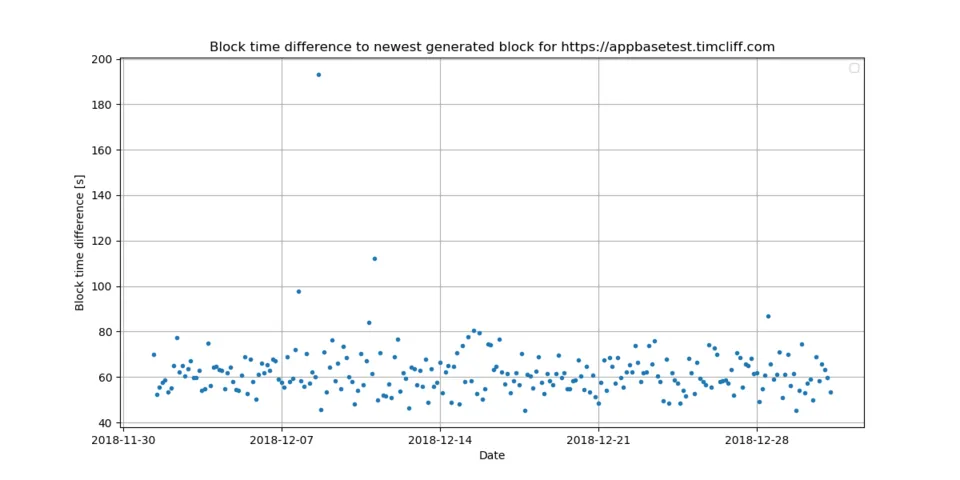
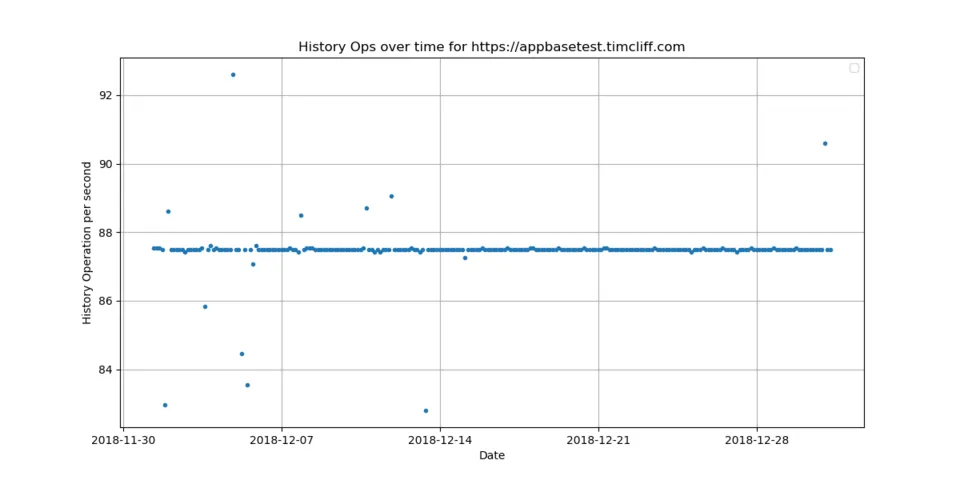
The https://appbasetest.timcliff.com node has a good performance. It handles around 87 history operation per second, 1 blocks per second and needs 12.06 seconds for an API call. The block delay is around 45 - 193 seconds.
https://steemd.privex.io
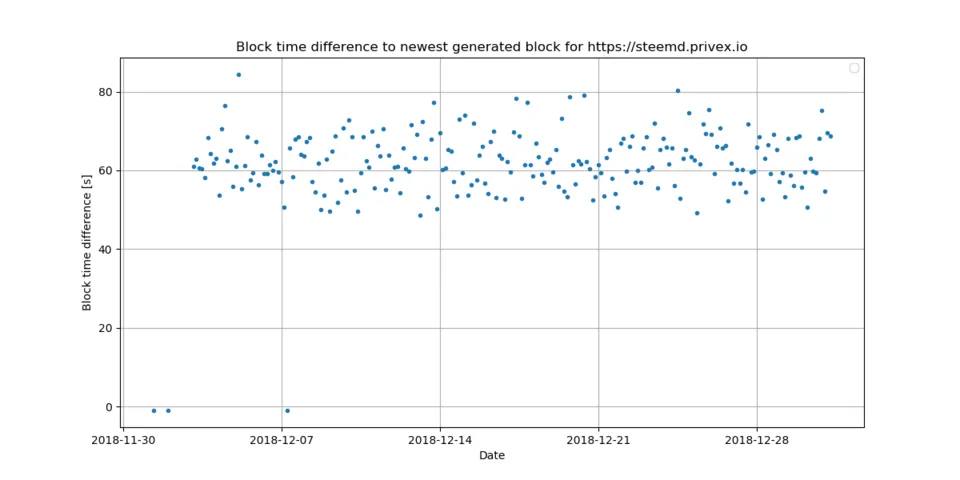
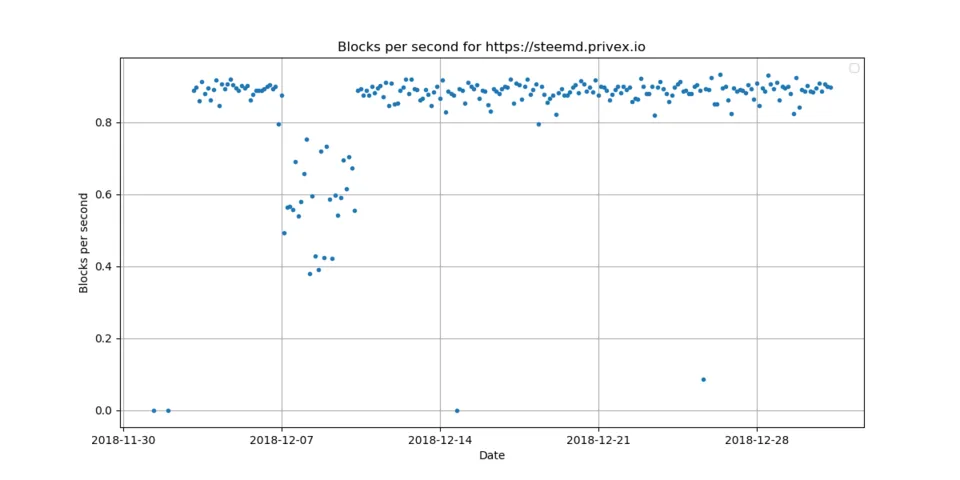
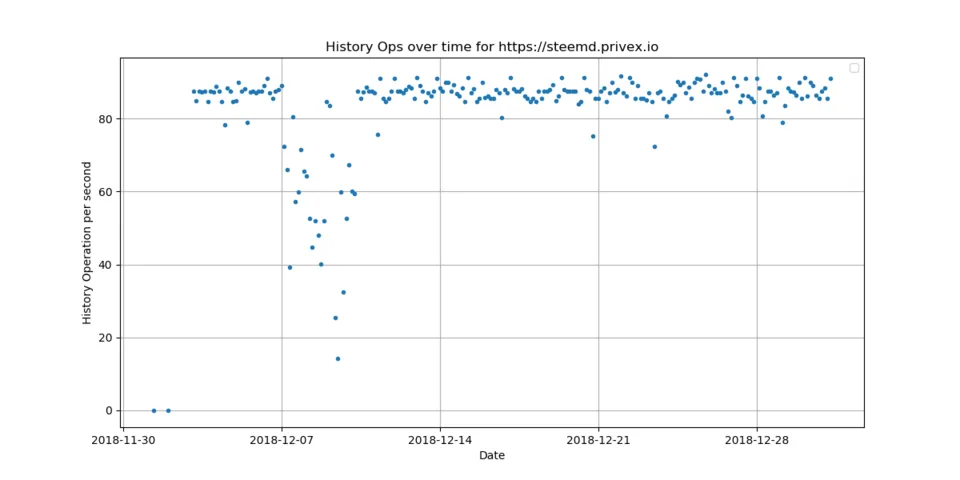
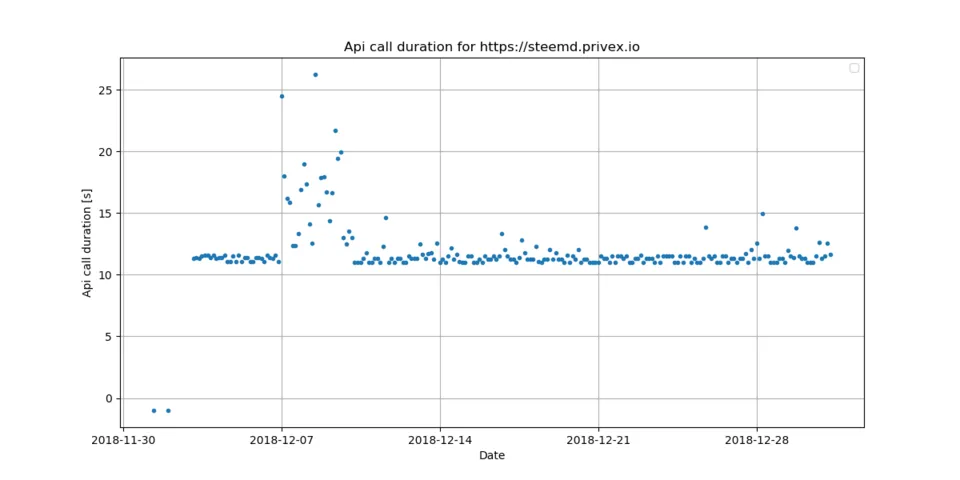
The https://steemd.privex.io node has a good performance. It handles around 83 history operation per second, 1 blocks per second and needs 11.91 seconds for an API call. The block delay is around 49 - 84 seconds.
Conclusion
Almost all websocket connection to full nodes are disabled now. One full node is not reachable (maybe https certificate problems) and one full node was shut down. This is not a big problem as all nodes are also reachable through an https connection.
The performance of all working nodes is very consistent and all full nodes show a good performance.
There is no up- or down trend in the performance visible, which is good, as it shows that the performance of the nodes is sufficient for handling the load.
Tools and Scripts
The following python script is used for generating all plots:
import sys
from datetime import datetime, timedelta, date
import time
import io
import json
from timeit import default_timer as timer
import logging
from beem.account import Account
from beem.steem import Steem
from beem.utils import formatTimedelta,formatTimeString, addTzInfo
from beem.nodelist import NodeList
import matplotlib as mpl

import matplotlib.pyplot as plt
log = logging.getLogger(__name__)
logging.basicConfig(level=logging.CRITICAL)


if __name__ == "__main__":

    node_stm = Steem(use_condenser=True)

    acc = Account("fullnodeupdate", steem_instance=node_stm)
    metadata_list = []
    stopdate = datetime.utcnow() - timedelta(days=30)
    startdate = datetime.utcnow()
    end_time = addTzInfo(datetime.utcnow())
    for h in acc.history_reverse(stop=stopdate, only_ops=["account_update"]):
        metadata_list.append(json.loads(h["json_metadata"]))
        end_time = formatTimeString(metadata_list[-1]["parameter"]["end_time"])

    timestamp = []
    working_nodes = []

    for metadata in metadata_list:
        report = metadata["report"]
        first_entry = True
        node_url_list = []
        for r in report:
            if r["node"] not in ["https://api.steemitstage.com", "https://api.steemitdev.com", "https://steemd-appbase.steemit.com", "wss://steemd-appbase.steemit.com"]:
                node_url = r["node"].split("://")[1]
                if node_url not in node_url_list:
                    node_url_list.append(node_url)
                    if first_entry:
                        first_entry = False
                        timestamp.append(formatTimeString(metadata["parameter"]["end_time"]))
                        working_nodes.append(1)
                    else:
                        working_nodes[-1] += 1


    timestamp_node = {}
    block_per_sec_node = {}
    history_per_sec_node = {}
    block_diff_seconds_node = {}
    apicall_time_node = {}
    block_diff_head_delay_node = {}
    block_diff_diff_head_irreversible_node = {}

    for metadata in metadata_list:
        report = metadata["report"]
        first_entry = True
        for r in report:
            if r["node"] not in ["https://api.steemitstage.com", "https://api.steemitdev.com", "https://steemd-appbase.steemit.com", "wss://steemd-appbase.steemit.com"]:


                if r["node"] not in timestamp_node:
                    timestamp_node[r["node"]] = [formatTimeString(metadata["parameter"]["end_time"])]

                    if r["block"]["rank"] > -1:
                        block_per_sec_node[r["node"]] = [(r["block"]["count"] / r["block"]["time"])]
                    else:
                        block_per_sec_node[r["node"]] = [0]
                    if r["history"]["rank"] > -1:
                        history_per_sec_node[r["node"]] = [r["history"]["count"] / r["history"]["time"]]
                    else:
                        history_per_sec_node[r["node"]] = [0]
                    if r["apicall"]["rank"] > -1:
                        apicall_time_node[r["node"]] = [(r["apicall"]["time"])]
                    else:
                        apicall_time_node[r["node"]] = [-1]
                    if r["block_diff"]["rank"] > -1:
                        block_diff_head_delay_node[r["node"]] = [(r["block_diff"]["head_delay"])]
                        block_diff_diff_head_irreversible_node[r["node"]] = [(r["block_diff"]["diff_head_irreversible"])]
                        block_diff_seconds_node[r["node"]] = [(r["block_diff"]["diff_head_irreversible"] * 3 + r["block_diff"]["head_delay"])]
                    else:
                        block_diff_head_delay_node[r["node"]] = [-1]
                        block_diff_diff_head_irreversible_node[r["node"]] = [-1]
                        block_diff_seconds_node[r["node"]] = [-1]
                else:
                    timestamp_node[r["node"]].append(formatTimeString(metadata["parameter"]["end_time"]))

                    if r["block"]["rank"] > -1:
                        block_per_sec_node[r["node"]].append(r["block"]["count"] / r["block"]["time"])
                    else:
                        block_per_sec_node[r["node"]].append(0)
                    if r["history"]["rank"] > -1:
                        history_per_sec_node[r["node"]].append(r["history"]["count"] / r["history"]["time"])
                    else:
                        history_per_sec_node[r["node"]].append(0)
                    if r["apicall"]["rank"] > -1:
                        apicall_time_node[r["node"]].append(r["apicall"]["time"])
                    else:
                        apicall_time_node[r["node"]].append(-1)
                    if r["block_diff"]["rank"] > -1:
                        block_diff_head_delay_node[r["node"]].append((r["block_diff"]["head_delay"]))
                        block_diff_diff_head_irreversible_node[r["node"]].append(r["block_diff"]["diff_head_irreversible"])
                        block_diff_seconds_node[r["node"]].append(r["block_diff"]["diff_head_irreversible"] * 3 + r["block_diff"]["head_delay"])
                    else:
                        block_diff_head_delay_node[r["node"]].append(-1)
                        block_diff_diff_head_irreversible_node[r["node"]].append(-1)
                        block_diff_seconds_node[r["node"]].append(-1)


    show_plots = False
    plt.figure(figsize=(12, 6))
    opts = {'linestyle': '', 'marker': '.'}
    plt.plot_date(timestamp, working_nodes, **opts)

    plt.grid()
    plt.legend()
    plt.title("Number of working nodes")
    plt.xlabel("Date")
    plt.ylabel("Number of working nodes")
    if show_plots:
        plt.show()
    else:
        plt.savefig("number_working_nodes.png")


    image_index = 0
    for node in timestamp_node:
        timestamp = timestamp_node[node]
        block_per_sec = block_per_sec_node[node]
        apicall_time = apicall_time_node[node]

        history_per_sec = history_per_sec_node[node]
        block_diff_seconds = block_diff_seconds_node[node]

        mean_hist = sum(history_per_sec) / len(history_per_sec)
        mean_block = sum(block_per_sec) / len(block_per_sec)
        mean_api = sum(apicall_time) / len(apicall_time)
        mean_diff = sum(block_diff_seconds) / len(block_diff_seconds)
        max_diff = 20
        min_diff = 80
        for x in block_diff_seconds:
            if x > max_diff and x < 1000:
                max_diff = x
            if x < min_diff and x > 0:
                min_diff = x

        print("The %s node has a  good performance. It handles around %.0f history operation per second, %.0f blocks per second and needs %.2f seconds for an API call. The block delay is around %.0f - %.0f seconds." % (node, mean_hist, mean_block, mean_api, min_diff, max_diff))

        plt.figure(figsize=(12, 6))
        opts = {'linestyle': '', 'marker': '.'}
        plt.plot_date(timestamp, block_per_sec, **opts)

        plt.grid()
        plt.legend()
        plt.title("Blocks per second for %s" % node)
        plt.xlabel("Date")
        plt.ylabel("Blocks per second")
        if show_plots:
            plt.show()
        else:
            plt.savefig("%d_blocks_per_second.png" % image_index)

        plt.figure(figsize=(12, 6))
        opts = {'linestyle': '', 'marker': '.'}
        plt.plot_date(timestamp, apicall_time, **opts)

        plt.grid()
        plt.legend()
        plt.title("Api call duration for %s" % node)
        plt.xlabel("Date")
        plt.ylabel("Api call duration [s]")
        if show_plots:
            plt.show()
        else:
            plt.savefig("%d_api_call.png" % image_index)

        plt.figure(figsize=(12, 6))
        opts = {'linestyle': '', 'marker': '.'}
        plt.plot_date(timestamp, history_per_sec, **opts)

        plt.grid()
        plt.legend()
        plt.title("History Ops over time for %s" % node)
        plt.xlabel("Date")
        plt.ylabel("History Operation per second")
        if show_plots:
            plt.show()
        else:
            plt.savefig("%d_history_ops.png" % image_index)

        plt.figure(figsize=(12, 6))
        opts = {'linestyle': '', 'marker': '.'}
        plt.plot_date(timestamp, block_diff_seconds, **opts)

        plt.grid()
        plt.legend()
        plt.title("Block time difference to newest generated block for %s" % node)
        plt.xlabel("Date")
        plt.ylabel("Block time difference [s]")
        if show_plots:
            plt.show()
        else:
            plt.savefig("%d_block_time_diff.png" % image_index)

        image_index += 1
Relevant Links and Resources
The benchmark for each full node was repeated every 3 hours and is stored in the @fullnodeupdate account. The benchmark can be found here:
https://github.com/holgern/steem-fullnode-update/
Repository
https://github.com/steemit/steem
This analysis is using measured data from the steem full node servers.