
Introduction
A full node server is necessary to receive specific steem blockchain data. There are API-calls for most use cases:
- receiving the newest posts for a feed of a specific user
- show all comments/replys of/to a user
- show who already voted for a post
- show the latest transfers of a user
- receiving the operation from the last 10 blocks
And so on.
All these information are organized in databases inside the full node. These databases are needing a lot of RAM, which makes them very expensive. Each server unit can handle only a limited number of responses per second. When the number of calls per second is higher than the server can handle, the delay time for each response will increase until the server breaks down. This report tries to measure the current state of all available full nodes.
Over the last 30 days, a benchmark was performed every 3 hours on all available full nodes. The results of these benchmarks are stored as account update in @fullnodeupdate. The following parameters were measured:
- Blocks per second - It was measured how many blocks could be streamed in 30 seconds.
- Api call duration - The mean duration of receiving a vote, a comment, and an account is measured in seconds
- Account history operation per second - It was measured how many account history operation could be streamed in 30 seconds
- Irreversible block time delay in seconds- The time difference of the latest irreversible block that the node returns to the newest block is measured
Available full nodes
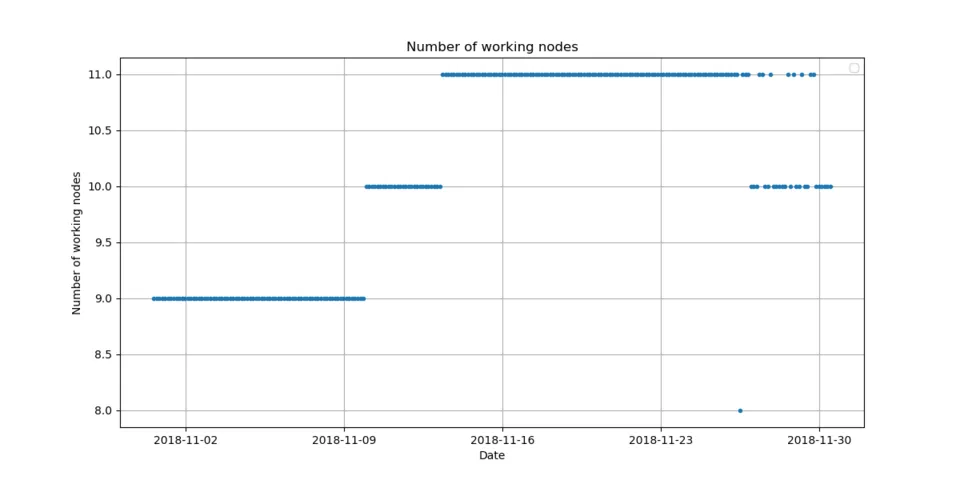
Over the last 30 days, at least 8 different full nodes were online and working.
https://steemd.minnowsupportproject.org
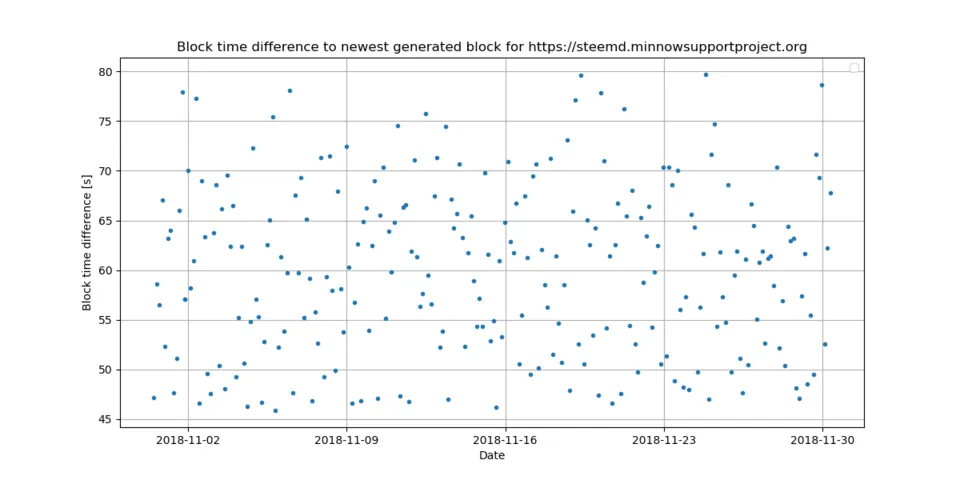
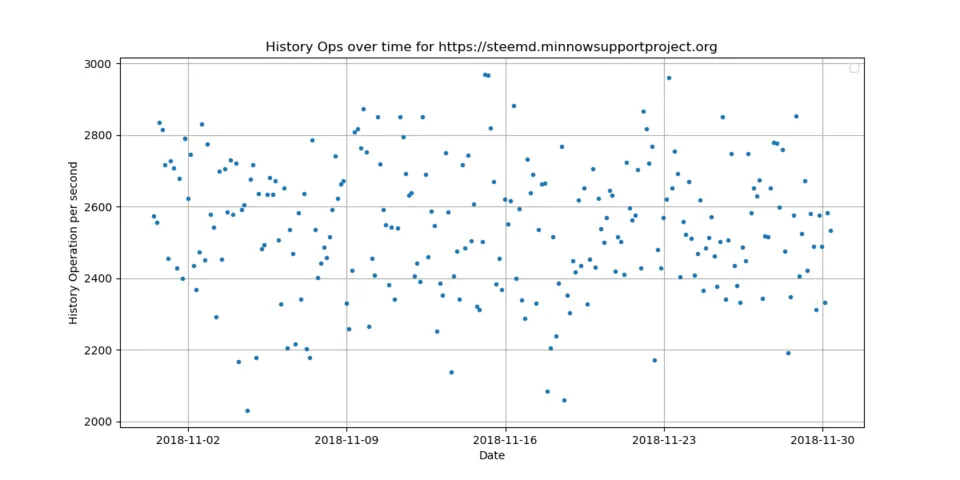
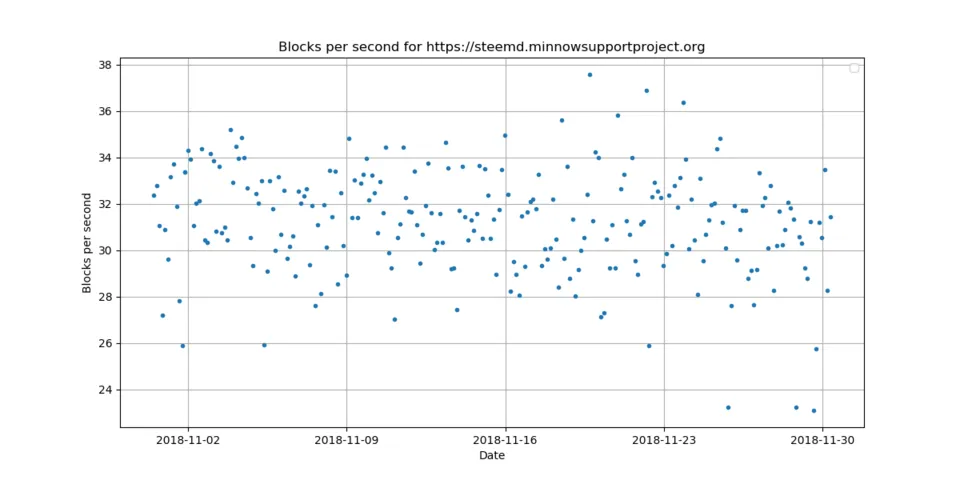
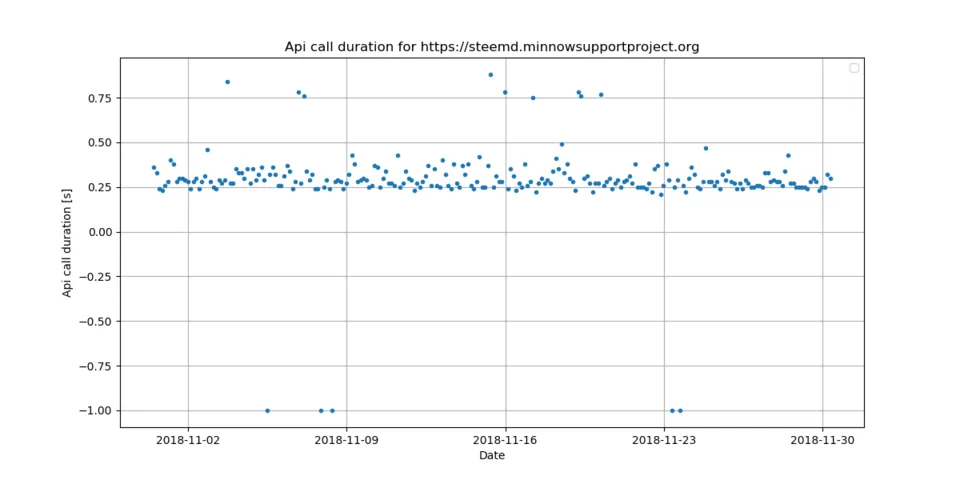
The https://steemd.minnowsupportproject.org node has an incredible performance. It handles around 2545 history operation per second, 31 blocks per second and needs only 0.28 seconds for an API call. The block delay is around 46 - 80 seconds.
https://anyx.io
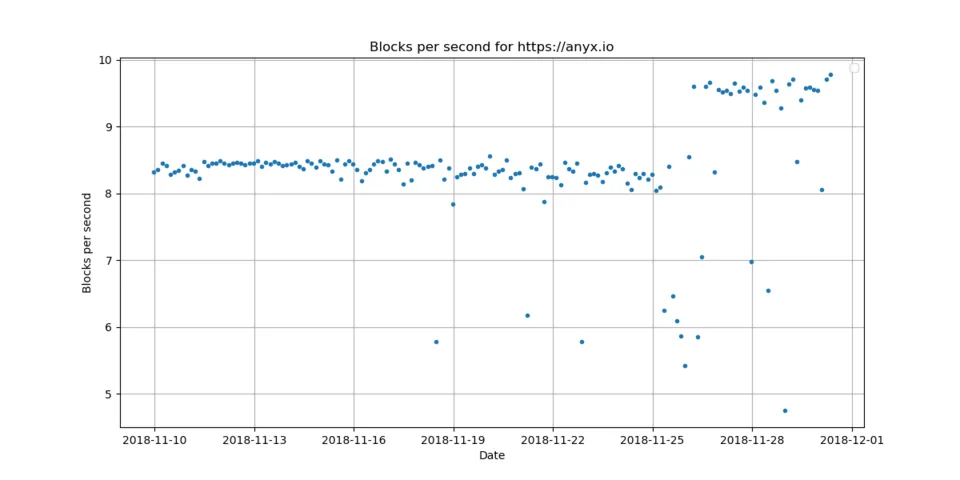
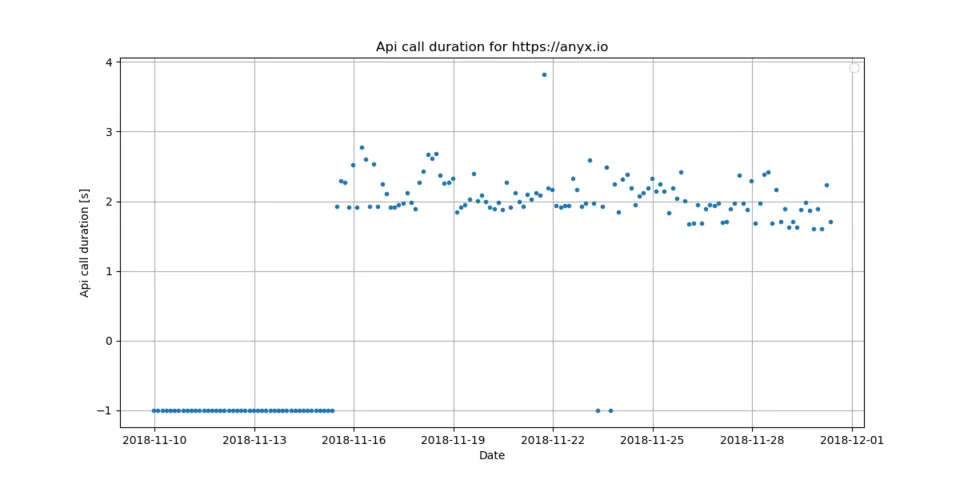
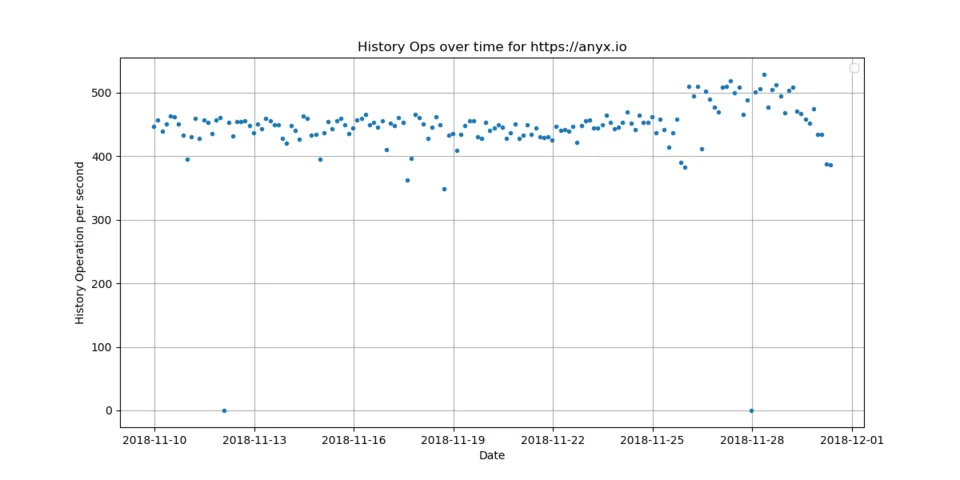
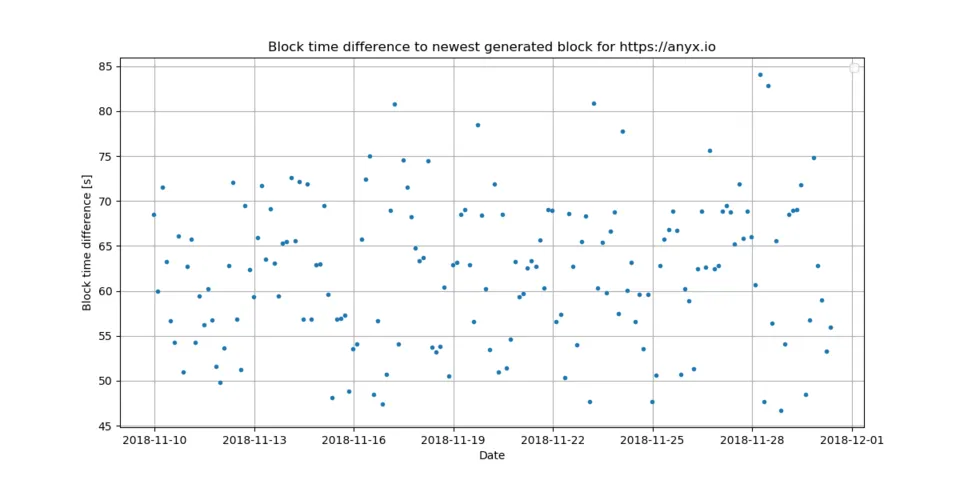
The https://anyx.io node has a good performance. It handles around 445 history operation per second, 8 blocks per second and needs 1.20 seconds for an API call. The block delay is around 47 - 84 seconds.
https://api.steemit.com
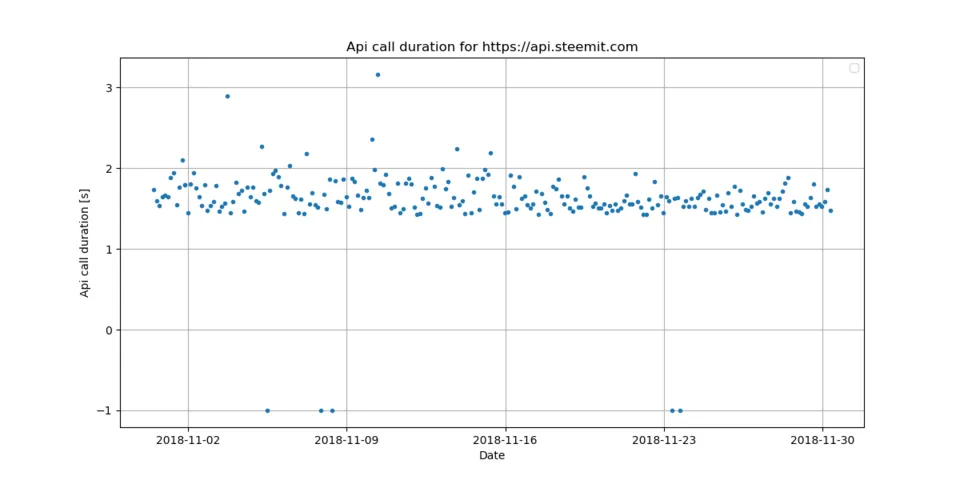
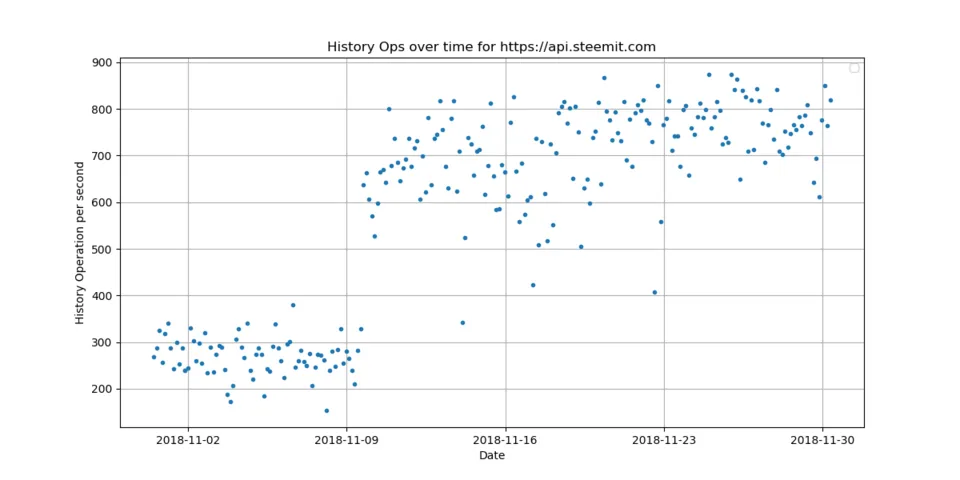
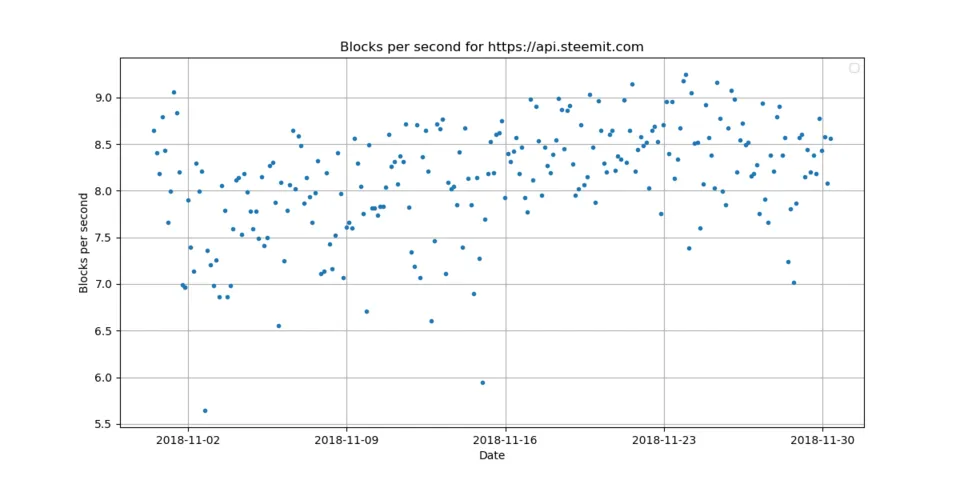
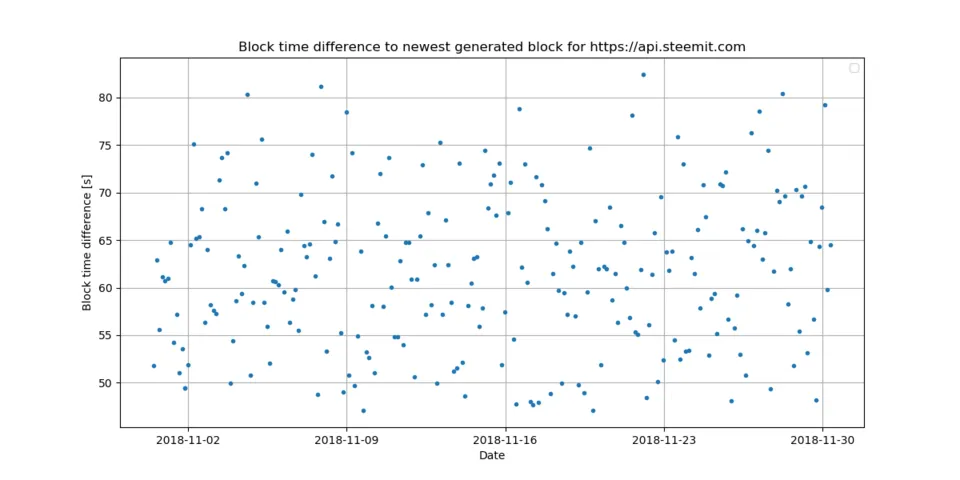
The https://api.steemit.com node has a good performance. It handles around 580 history operation per second, 8 blocks per second and needs 1.60 seconds for an API call. The block delay is around 47 - 82 seconds.
wss://gtg.steem.house:8090
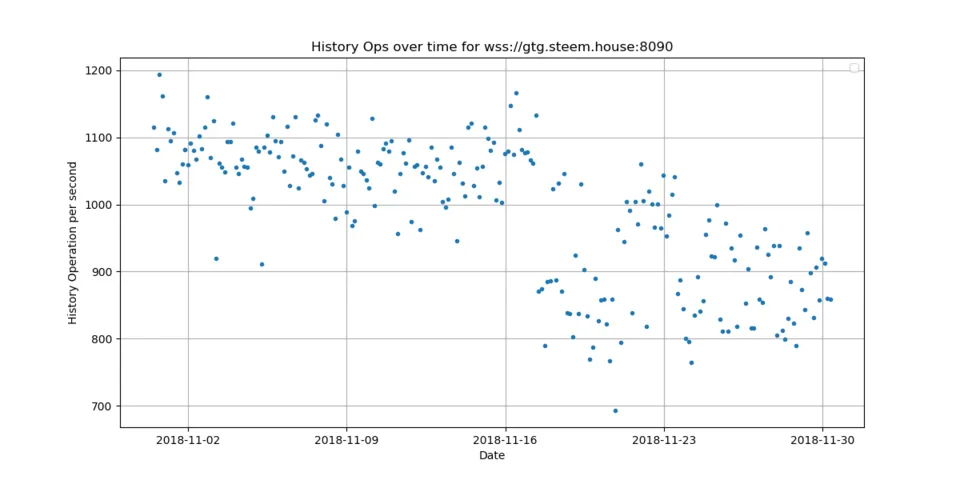
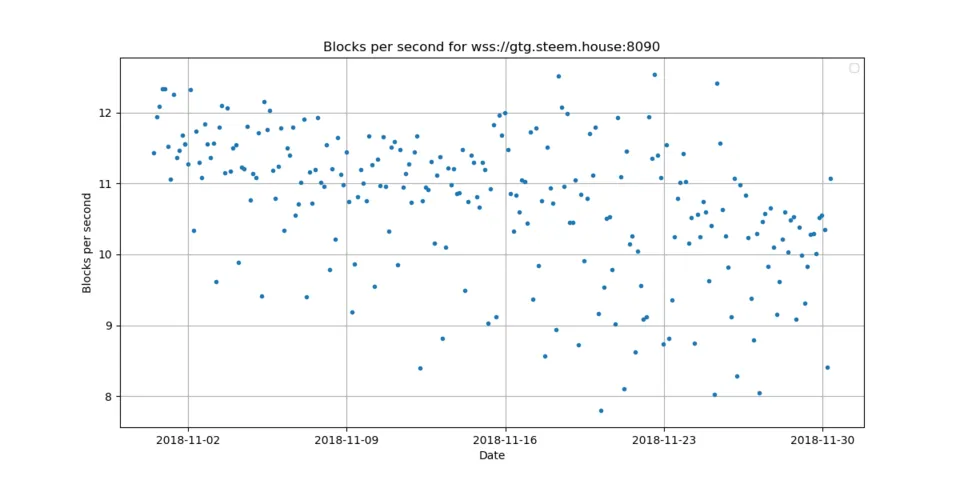
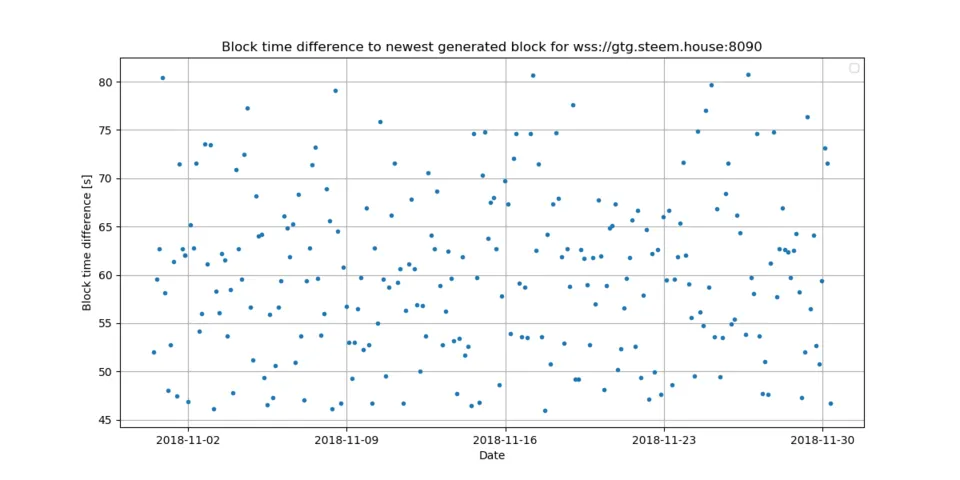
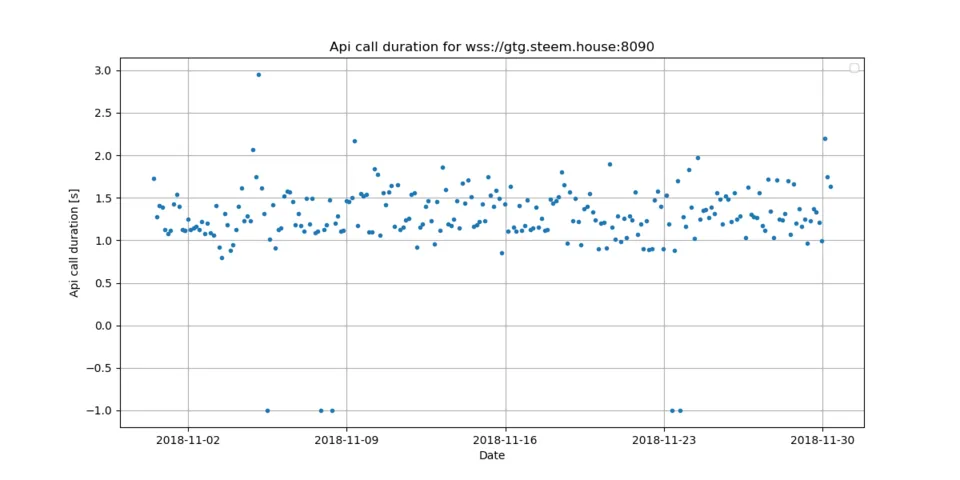
The wss://gtg.steem.house:8090 node has a very good performance. It handles around 989 history operation per second, 11 blocks per second and needs 1.27 seconds for an API call. The block delay is around 46 - 81 seconds.
https://rpc.steemliberator.com
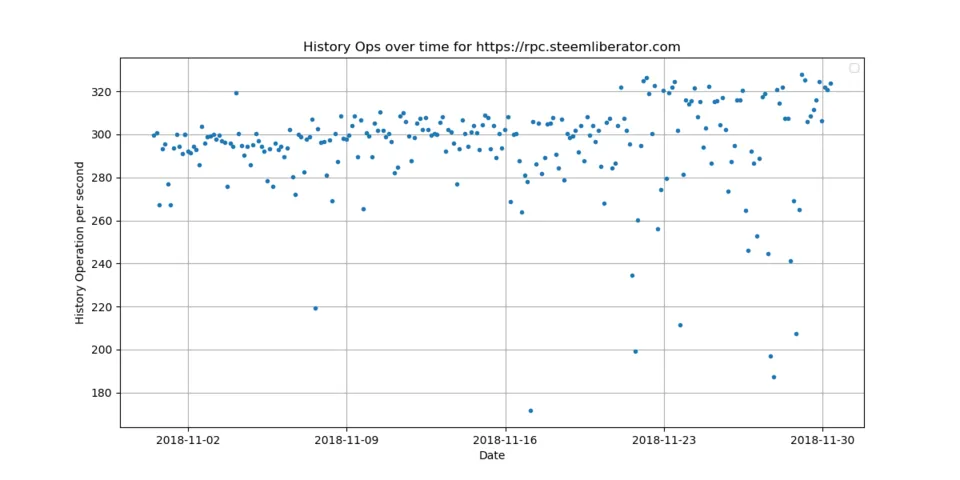
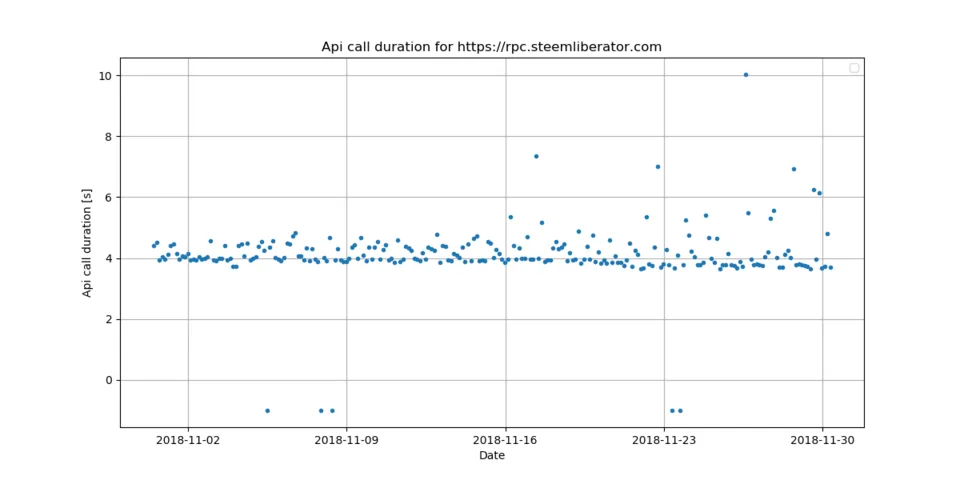
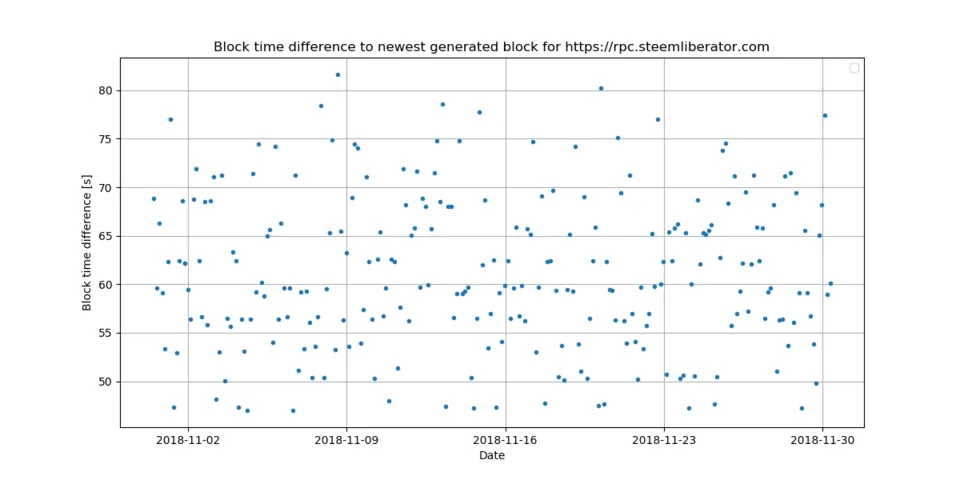
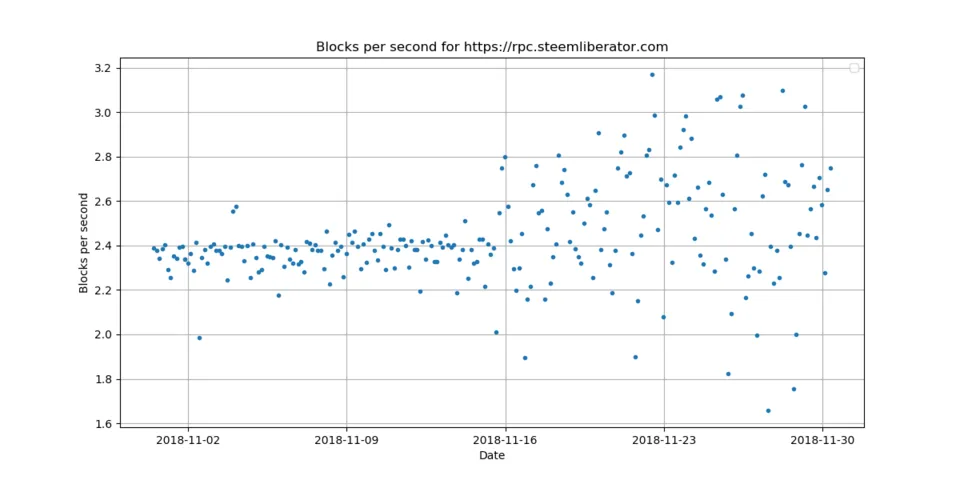
The https://rpc.steemliberator.com node has a satisfactory performance. It handles around 295 history operation per second, 2 blocks per second and needs 4.11 seconds for an API call. The block delay is around 47 - 82 seconds.
https://api.steem.house
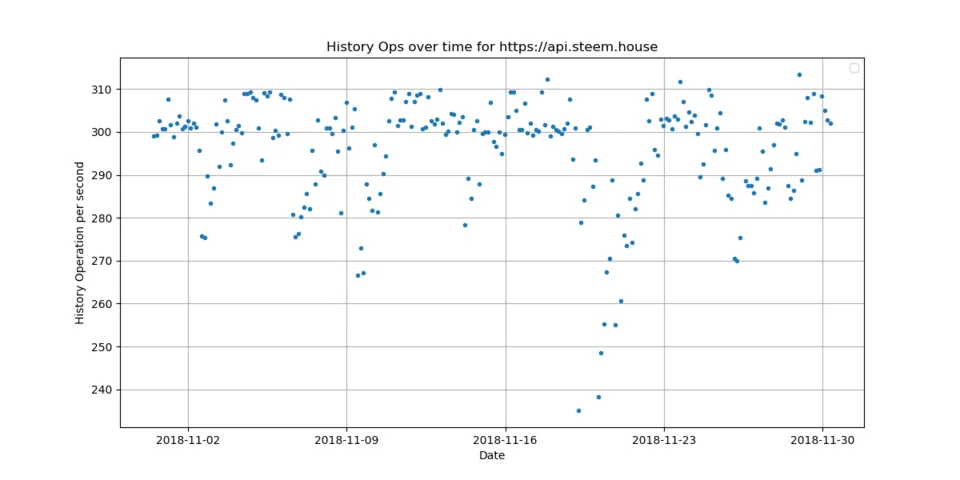
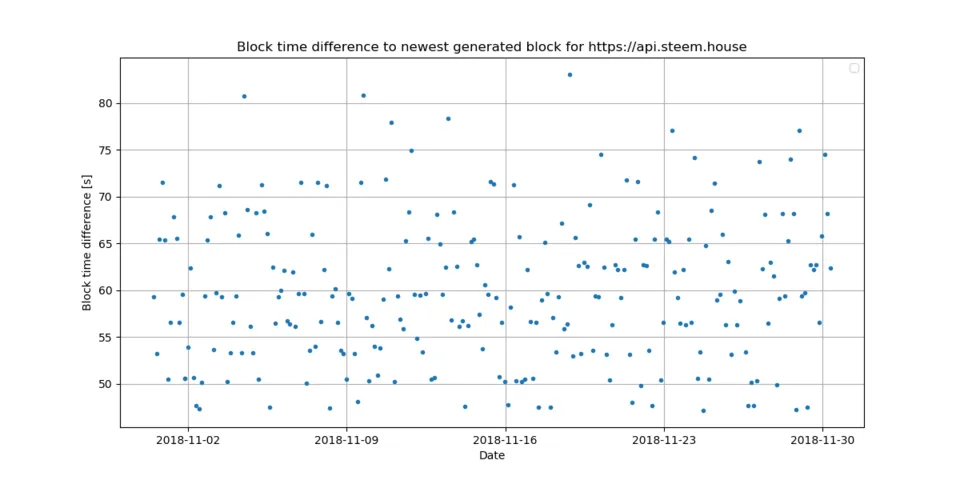
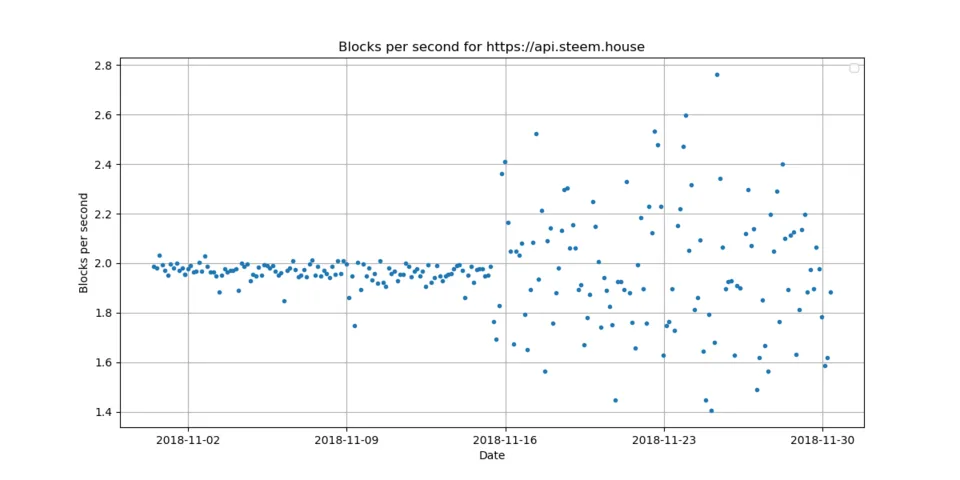
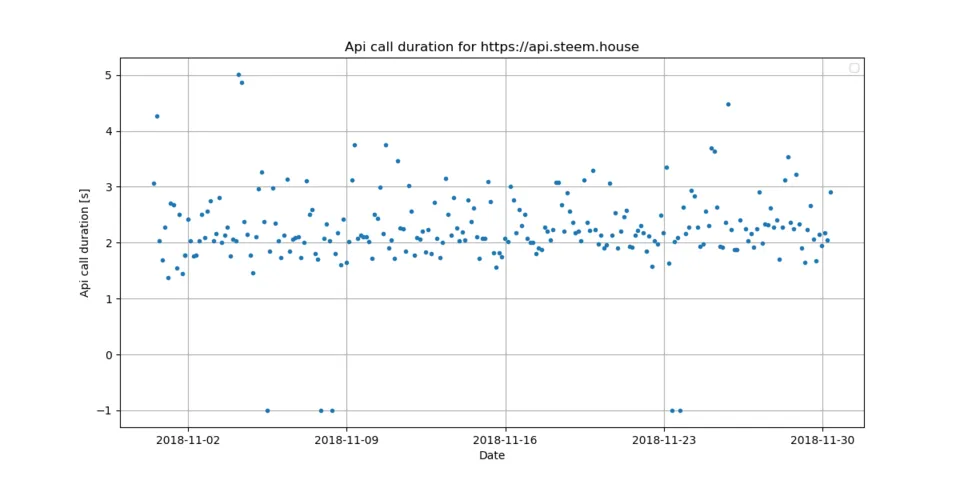
The https://api.steem.house node has a satisfactory performance. It handles around 296 history operation per second, 2 blocks per second and needs 2.24 seconds for an API call. The block delay is around 47 - 83 seconds.
wss://rpc.curiesteem.com
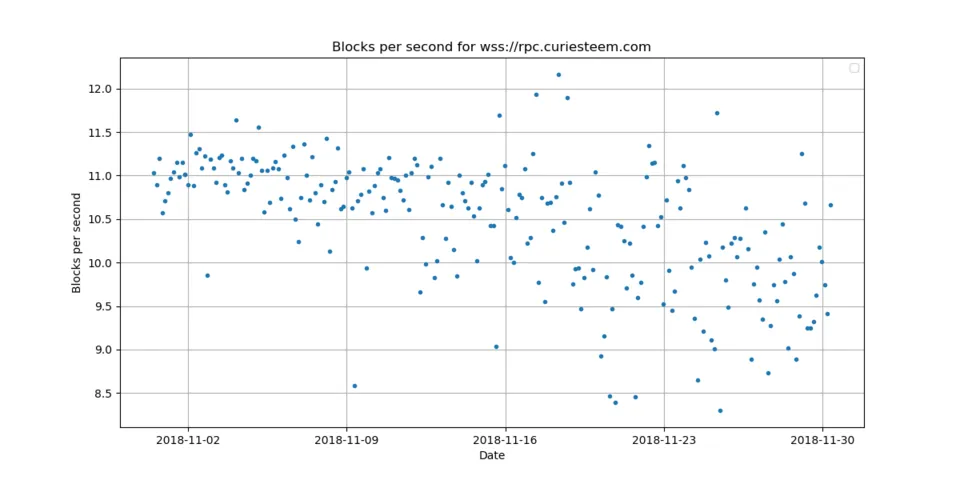
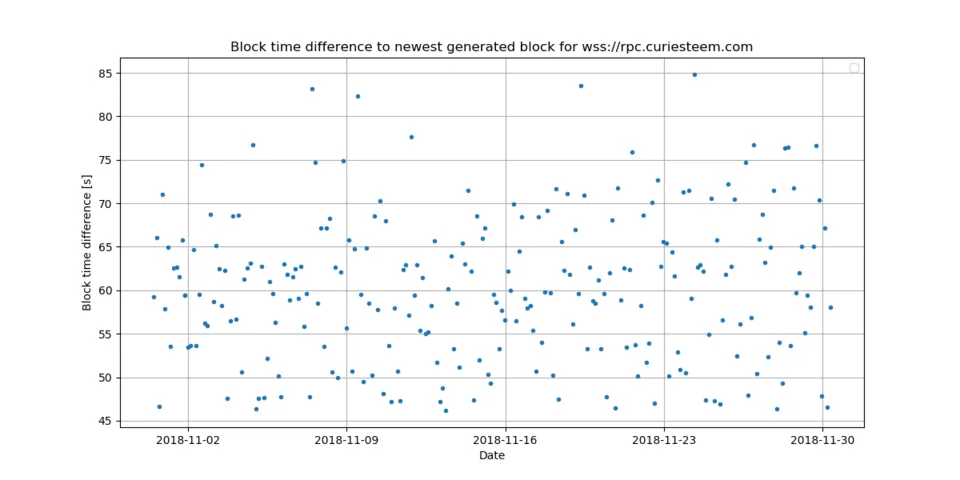
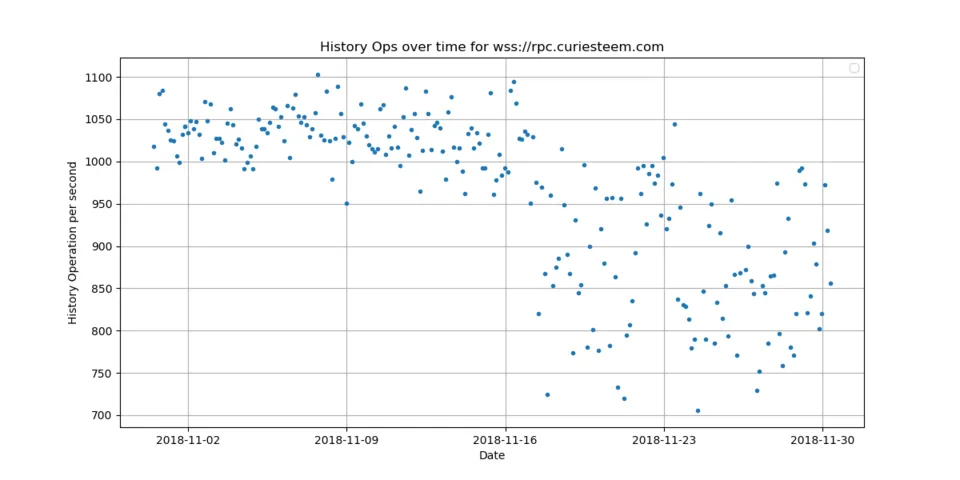

The wss://rpc.curiesteem.com node has a good performance. It handles around 964 history operation per second, 10 blocks per second and needs 2.89 seconds for an API call. The block delay is around 46 - 85 seconds.
https://rpc.steemviz.com
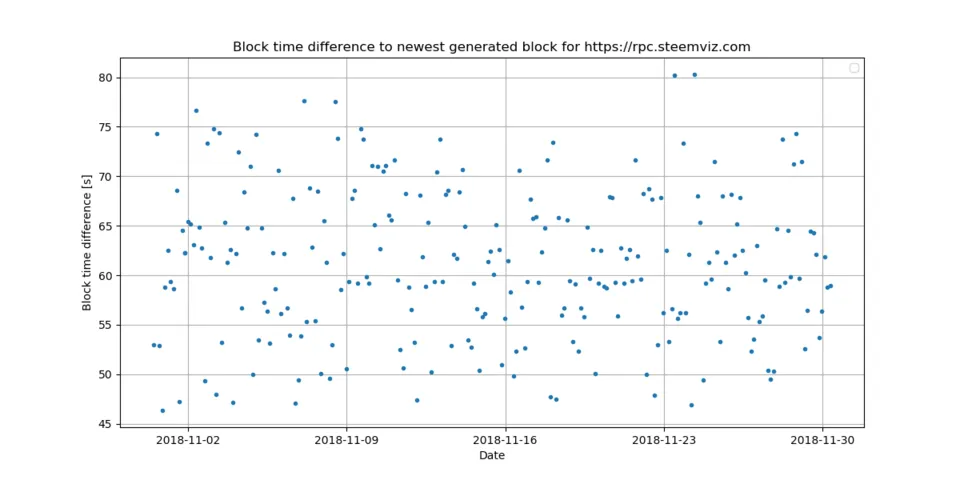
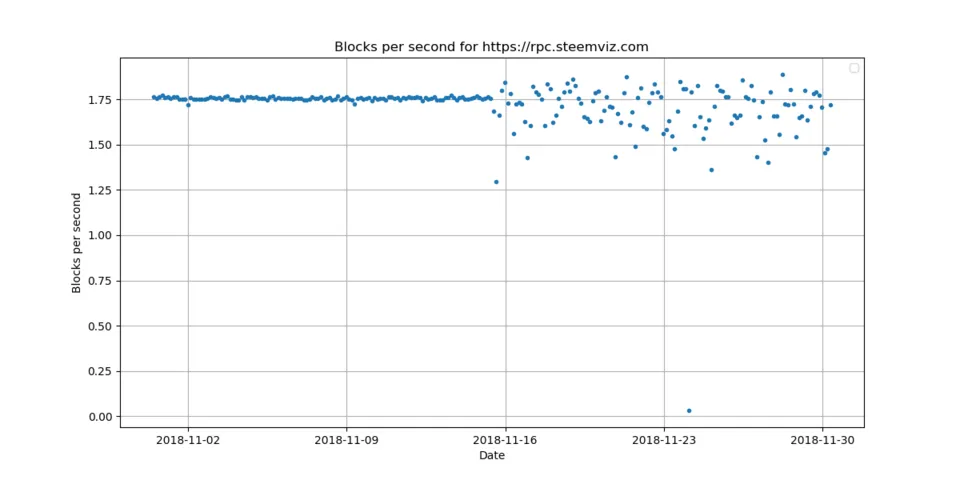
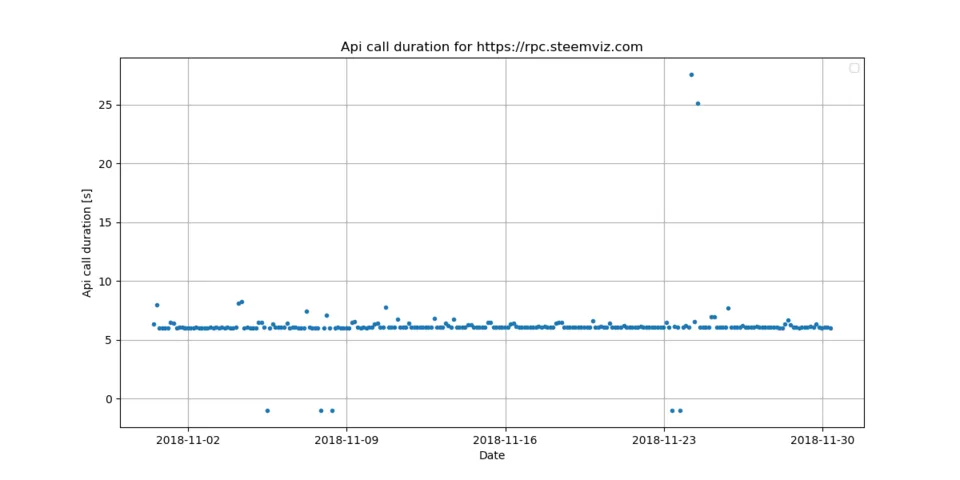
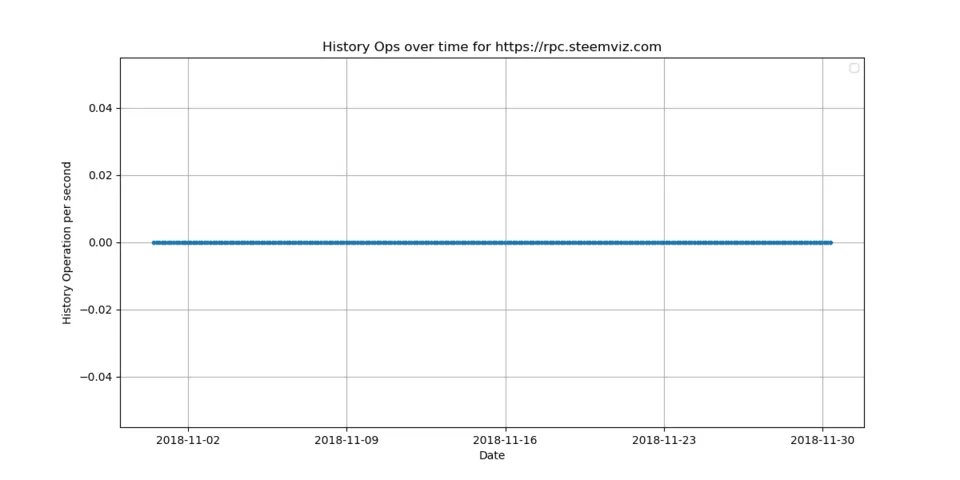
The https://rpc.steemviz.com node has a sufficient performance. It handles around 0 history operation per second, 2 blocks per second and needs 6.20 seconds for an API call. The block delay is around 46 - 80 seconds.
https://appbasetest.timcliff.com
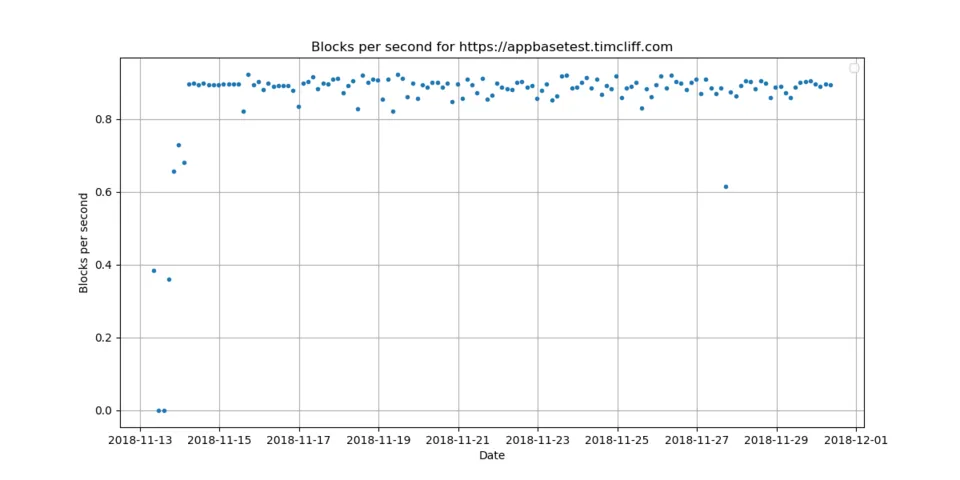
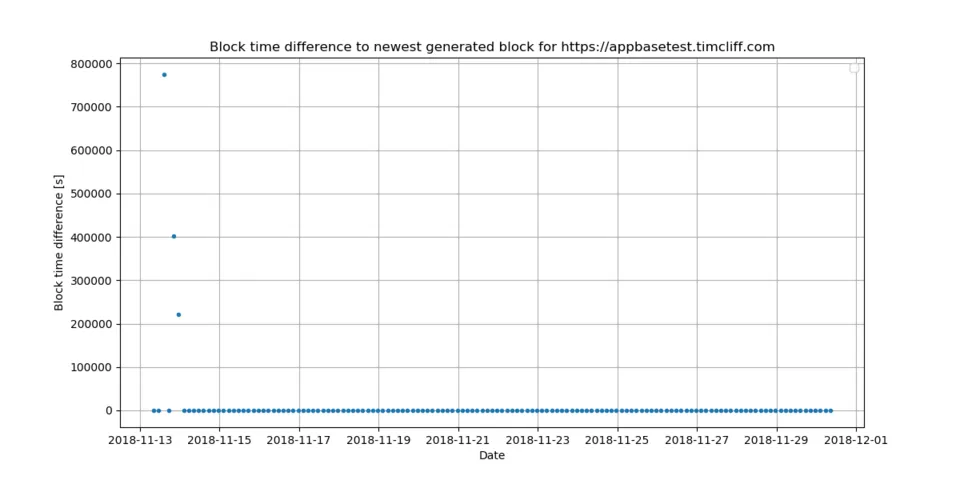
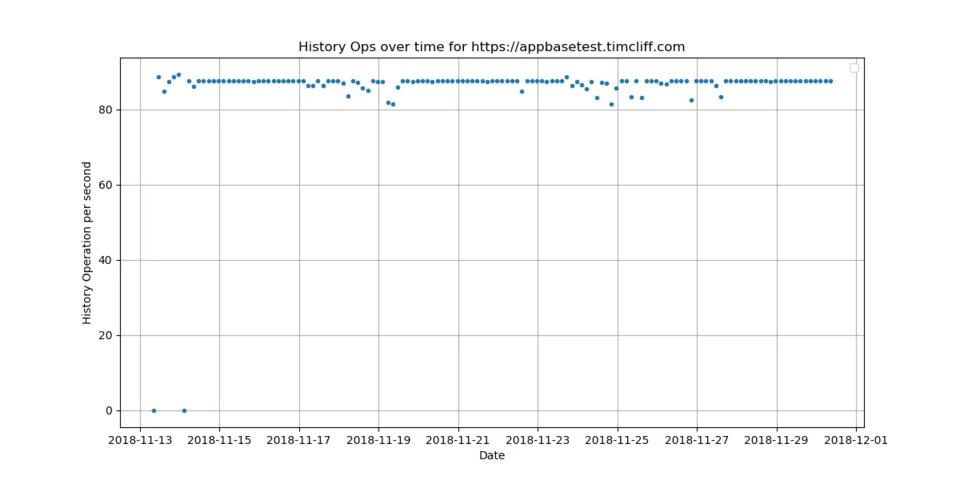
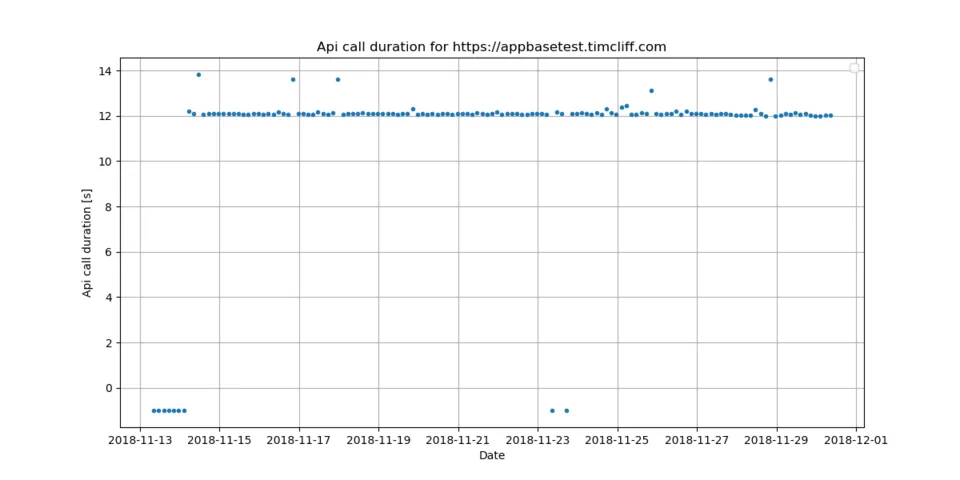
The https://appbasetest.timcliff.com node has a sufficient performance. It handles around 86 history operation per second, 1 blocks per second and needs 11.30 seconds for an API call. The block delay is around 45 - 180 seconds.
https://steemd.privex.io
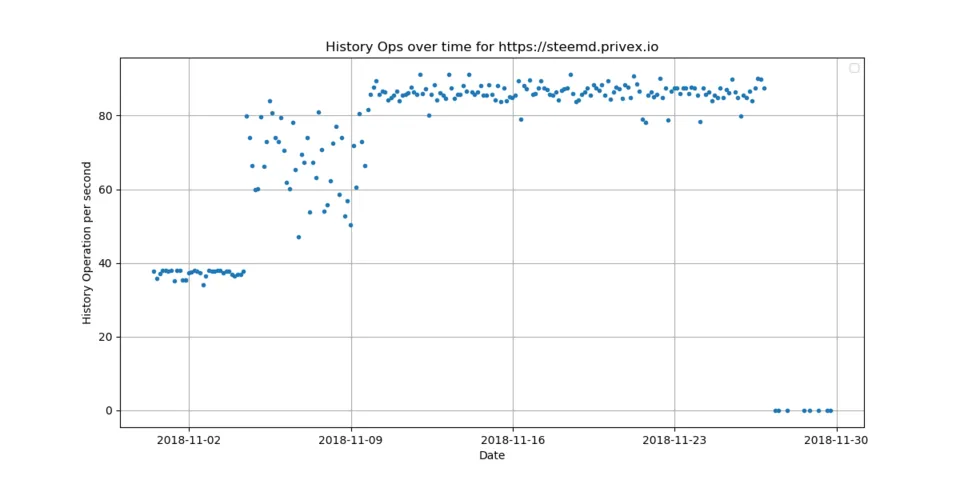
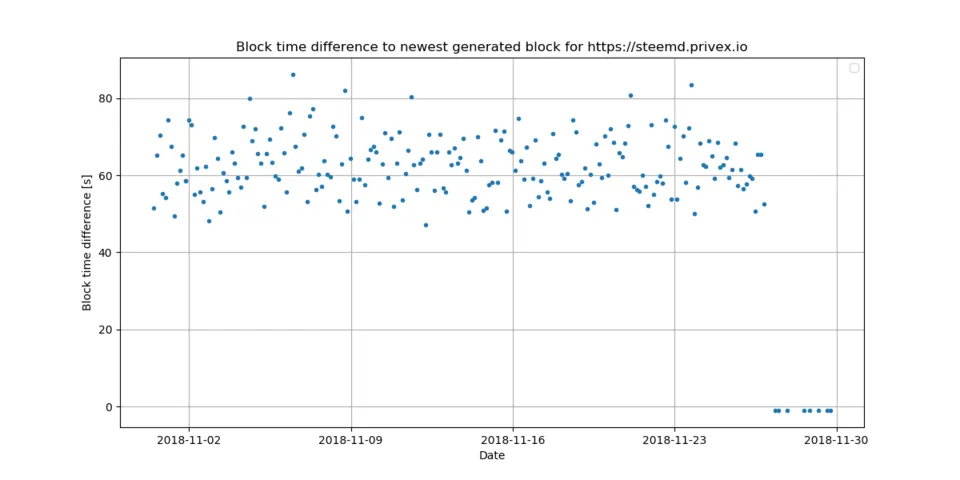
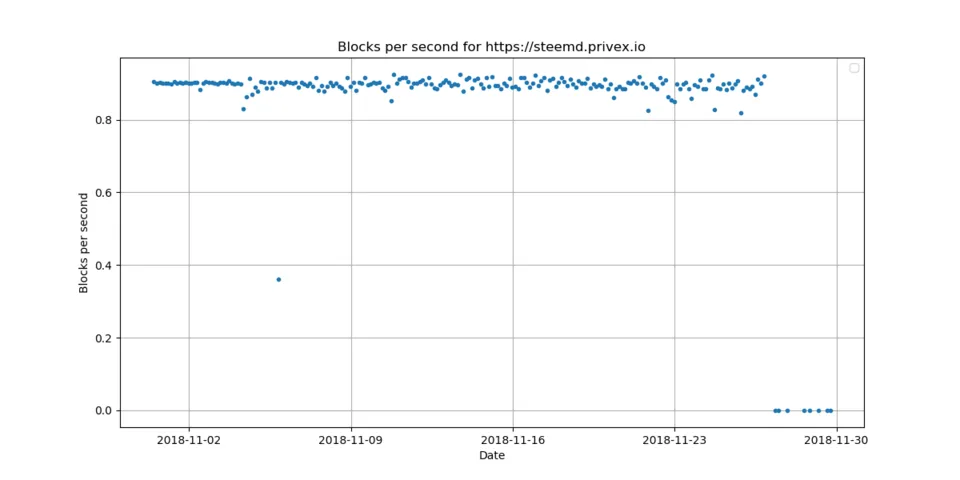
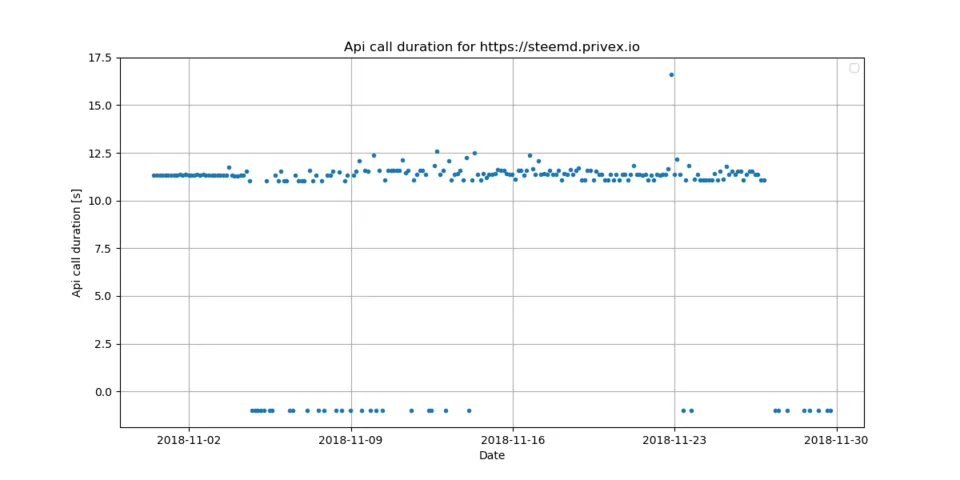
The https://steemd.privex.io node has a sufficient performance. It handles around 72 history operation per second, 1 blocks per second and needs 9.50 seconds for an API call. The block delay is around 47 - 86 seconds.
Conclusion
Over the last month, 8 to 11 different full nodes were available online. Some of the nodes are faster than others, but most of the nodes were useable over the last month. The benchmark shows only the current state of the node and does know nothing about the specific load. The api.steemit.com node is the default node and used for the steemit.com website. Thus, its load is significantly higher than the load of other nodes. I also do not know which nodes are consists of more than one server. I assume that the full node from steemit.com consists of several servers and that the load is handled by a load balancer.
Tools and Scripts
The following python script is used for generating all plots:
import sys
from datetime import datetime, timedelta, date
import time
import io
import json
from timeit import default_timer as timer
import logging
from beem.account import Account
from beem.steem import Steem
from beem.utils import formatTimedelta,formatTimeString, addTzInfo
from beem.nodelist import NodeList
import matplotlib as mpl

import matplotlib.pyplot as plt
log = logging.getLogger(__name__)
logging.basicConfig(level=logging.CRITICAL)


if __name__ == "__main__":


    # nobroadcast = True

    node_stm = Steem(use_condenser=True)

    acc = Account("fullnodeupdate", steem_instance=node_stm)
    metadata_list = [] # json.loads(acc["json_metadata"])
    stopdate = datetime.utcnow() - timedelta(days=30)
    startdate = datetime.utcnow()
    end_time = addTzInfo(datetime.utcnow())
    for h in acc.history_reverse(stop=stopdate, only_ops=["account_update"]):
        metadata_list.append(json.loads(h["json_metadata"]))
        end_time = formatTimeString(metadata_list[-1]["parameter"]["end_time"])

    timestamp = []
    working_nodes = []

    for metadata in metadata_list:
        report = metadata["report"]
        first_entry = True
        node_url_list = []
        for r in report:
            if r["node"] not in ["https://api.steemitstage.com", "https://api.steemitdev.com", "https://steemd-appbase.steemit.com", "wss://steemd-appbase.steemit.com"]:
                node_url = r["node"].split("://")[1]
                if node_url not in node_url_list:
                    node_url_list.append(node_url)
                    if first_entry:
                        first_entry = False
                        timestamp.append(formatTimeString(metadata["parameter"]["end_time"]))
                        working_nodes.append(1)
                    else:
                        working_nodes[-1] += 1


    timestamp_node = {}
    block_per_sec_node = {}
    history_per_sec_node = {}
    block_diff_seconds_node = {}
    apicall_time_node = {}
    block_diff_head_delay_node = {}
    block_diff_diff_head_irreversible_node = {}

    for metadata in metadata_list:
        report = metadata["report"]
        first_entry = True
        for r in report:
            if r["node"] not in ["https://api.steemitstage.com", "https://api.steemitdev.com", "https://steemd-appbase.steemit.com", "wss://steemd-appbase.steemit.com"]:


                if r["node"] not in timestamp_node:
                    timestamp_node[r["node"]] = [formatTimeString(metadata["parameter"]["end_time"])]

                    if r["block"]["rank"] > -1:
                        block_per_sec_node[r["node"]] = [(r["block"]["count"] / r["block"]["time"])]
                    else:
                        block_per_sec_node[r["node"]] = [0]
                    if r["history"]["rank"] > -1:
                        history_per_sec_node[r["node"]] = [r["history"]["count"] / r["history"]["time"]]
                    else:
                        history_per_sec_node[r["node"]] = [0]
                    if r["apicall"]["rank"] > -1:
                        apicall_time_node[r["node"]] = [(r["apicall"]["time"])]
                    else:
                        apicall_time_node[r["node"]] = [-1]
                    if r["block_diff"]["rank"] > -1:
                        block_diff_head_delay_node[r["node"]] = [(r["block_diff"]["head_delay"])]
                        block_diff_diff_head_irreversible_node[r["node"]] = [(r["block_diff"]["diff_head_irreversible"])]
                        block_diff_seconds_node[r["node"]] = [(r["block_diff"]["diff_head_irreversible"] * 3 + r["block_diff"]["head_delay"])]
                    else:
                        block_diff_head_delay_node[r["node"]] = [-1]
                        block_diff_diff_head_irreversible_node[r["node"]] = [-1]
                        block_diff_seconds_node[r["node"]] = [-1]
                else:
                    timestamp_node[r["node"]].append(formatTimeString(metadata["parameter"]["end_time"]))

                    if r["block"]["rank"] > -1:
                        block_per_sec_node[r["node"]].append(r["block"]["count"] / r["block"]["time"])
                    else:
                        block_per_sec_node[r["node"]].append(0)
                    if r["history"]["rank"] > -1:
                        history_per_sec_node[r["node"]].append(r["history"]["count"] / r["history"]["time"])
                    else:
                        history_per_sec_node[r["node"]].append(0)
                    if r["apicall"]["rank"] > -1:
                        apicall_time_node[r["node"]].append(r["apicall"]["time"])
                    else:
                        apicall_time_node[r["node"]].append(-1)
                    if r["block_diff"]["rank"] > -1:
                        block_diff_head_delay_node[r["node"]].append((r["block_diff"]["head_delay"]))
                        block_diff_diff_head_irreversible_node[r["node"]].append(r["block_diff"]["diff_head_irreversible"])
                        block_diff_seconds_node[r["node"]].append(r["block_diff"]["diff_head_irreversible"] * 3 + r["block_diff"]["head_delay"])
                    else:
                        block_diff_head_delay_node[r["node"]].append(-1)
                        block_diff_diff_head_irreversible_node[r["node"]].append(-1)
                        block_diff_seconds_node[r["node"]].append(-1)


    show_plots = False
    plt.figure(figsize=(12, 6))
    opts = {'linestyle': '', 'marker': '.'}
    plt.plot_date(timestamp, working_nodes, **opts)

    plt.grid()
    plt.legend()
    plt.title("Number of working nodes")
    plt.xlabel("Date")
    plt.ylabel("Number of working nodes")
    if show_plots:
        plt.show()
    else:
        plt.savefig("number_working_nodes.png")


    image_index = 0
    for node in timestamp_node:
        timestamp = timestamp_node[node]
        block_per_sec = block_per_sec_node[node]
        apicall_time = apicall_time_node[node]

        history_per_sec = history_per_sec_node[node]
        block_diff_seconds = block_diff_seconds_node[node]

        plt.figure(figsize=(12, 6))
        opts = {'linestyle': '', 'marker': '.'}
        plt.plot_date(timestamp, block_per_sec, **opts)

        plt.grid()
        plt.legend()
        plt.title("Blocks per second for %s" % node)
        plt.xlabel("Date")
        plt.ylabel("Blocks per second")
        if show_plots:
            plt.show()
        else:
            plt.savefig("%d_blocks_per_second.png" % image_index)

        plt.figure(figsize=(12, 6))
        opts = {'linestyle': '', 'marker': '.'}
        plt.plot_date(timestamp, apicall_time, **opts)

        plt.grid()
        plt.legend()
        plt.title("Api call duration for %s" % node)
        plt.xlabel("Date")
        plt.ylabel("Api call duration [s]")
        if show_plots:
            plt.show()
        else:
            plt.savefig("%d_api_call.png" % image_index)

        plt.figure(figsize=(12, 6))
        opts = {'linestyle': '', 'marker': '.'}
        plt.plot_date(timestamp, history_per_sec, **opts)

        plt.grid()
        plt.legend()
        plt.title("History Ops over time for %s" % node)
        plt.xlabel("Date")
        plt.ylabel("History Operation per second")
        if show_plots:
            plt.show()
        else:
            plt.savefig("%d_history_ops.png" % image_index)

        plt.figure(figsize=(12, 6))
        opts = {'linestyle': '', 'marker': '.'}
        plt.plot_date(timestamp, block_diff_seconds, **opts)

        plt.grid()
        plt.legend()
        plt.title("Block time difference to newest generated block for %s" % node)
        plt.xlabel("Date")
        plt.ylabel("Block time difference [s]")
        if show_plots:
            plt.show()
        else:
            plt.savefig("%d_block_time_diff.png" % image_index)

        image_index += 1
Relevant Links and Resources
The benchmark of the each fullnode was repeated every 3 hours and is stored in the @fullnodeupdate account. The benchmark can be found here:
https://github.com/holgern/steem-fullnode-update/
Repository
https://github.com/steemit/steem
This analysis is using measured data from the steem full node servers.