
Repository
https://github.com/steemit/condenser
Overview
Churn is a fact of life in business. You will win new users and you will lose users. Churn measures how many users you are losing. Whereas retention measures how many users you are keeping. Churn can be calculated by the following formula
Churn = Number of Active users at the beginning of the period + New registrations – Number of Active users at the end of the period.
Churn rate can be calculated using
Churn rate = Churn / Number of Active users at the beginning of the period.
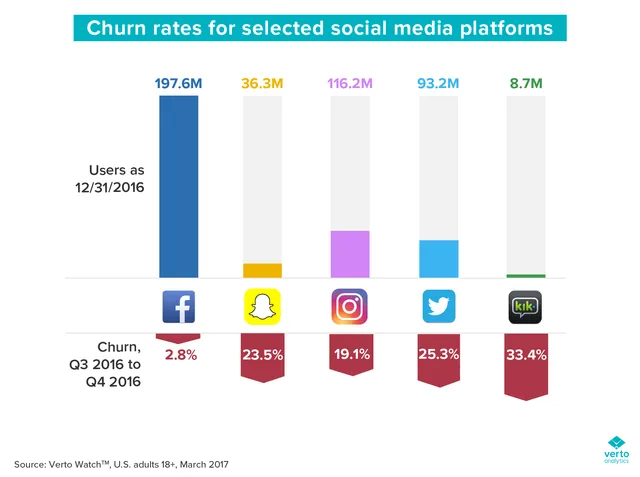
A high churn rate on a social media/networking site would indicate low engagement lack of loyalty and high dissatisfaction. To give us some sort of base to use as a benchmark for STEEM, I have taken this chart from vertoanalytics.com
Aim of Analysis
The aim of this analysis is to calculate the churn rate on STEEM as a social networking type blockchain* for Q4 of 2018 and compare this to the rest of the year. You can view the Q3 Churn report here
/@paulag/steem-churn-rates-q3-report-1539594273954
*STEEM is not only used a as a social networking type blockchain. Some people are investors and wallet holders only. Therefore, I have taken figures for all new registered accounts and I have also taken figures for those that have either poster or voted or both and excluded those that have not.
All data for this analysis was taken from Steemsql held and managed by @arcange. As to not distract from the data, I will first present the findings and then the queries used.
Monthly Churn 2018
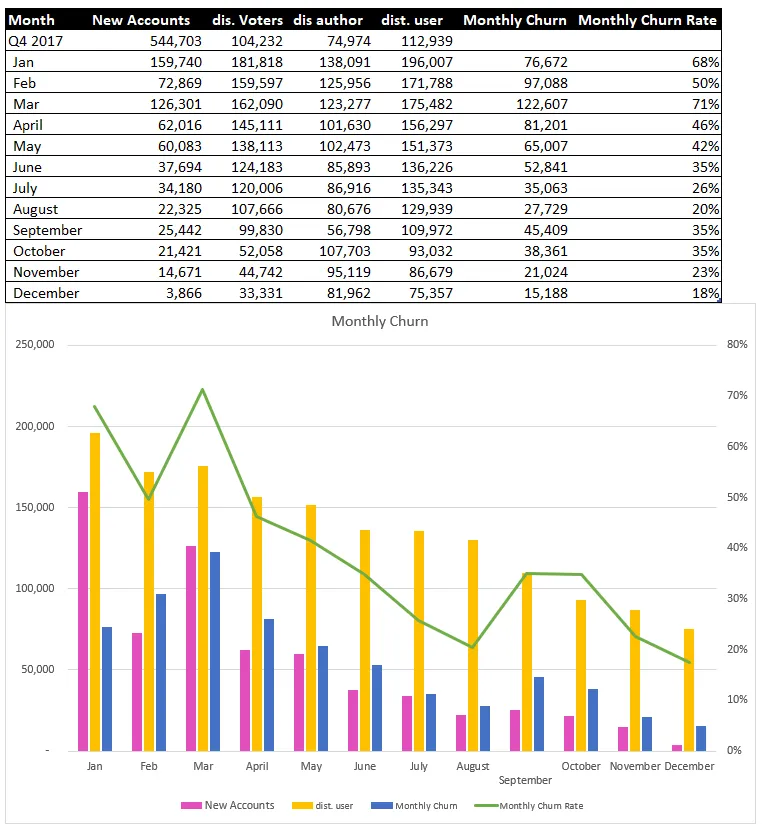
The table and chart above show the monthly churn and churn rates including ALL registered accounts as new accounts, no matter what their actively level on the block.
It is clear to see from this that the churn has been reducing for the most part of this year, with a period of increase from August to October.
The average monthly churn rate for 2018 was 39% and the median is 35%
Not all accounts became active in a social sense. Some accounts are just wallet holders. To reflect this the table and chart below have an adjusted in the new account’s column. This column now only includes accounts that have either voted or posted. Churn and churn rates are calculated the same as above.
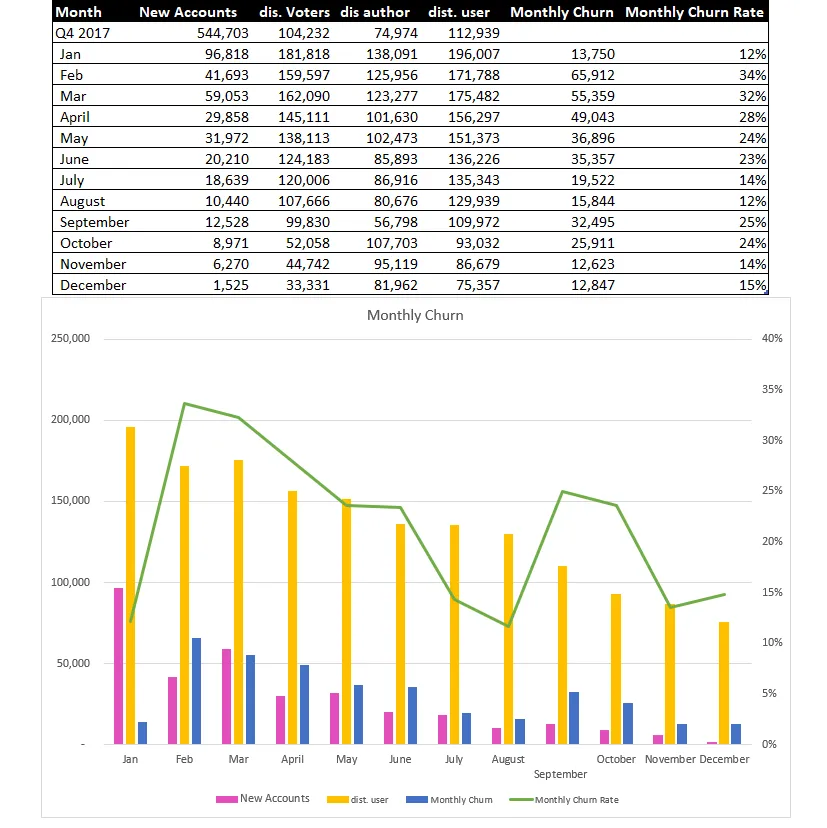
From this we can see churn reduced from Feb to August, increasing again in September and then reducing again for October and November and an increase in December. All in all, monthly churn rates when you only include accounts that either/or post/vote show a lower churn than that including all accounts.
The average monthly churn rate calculated this way was 21% and the median was 23.5%
Quarterly Churn
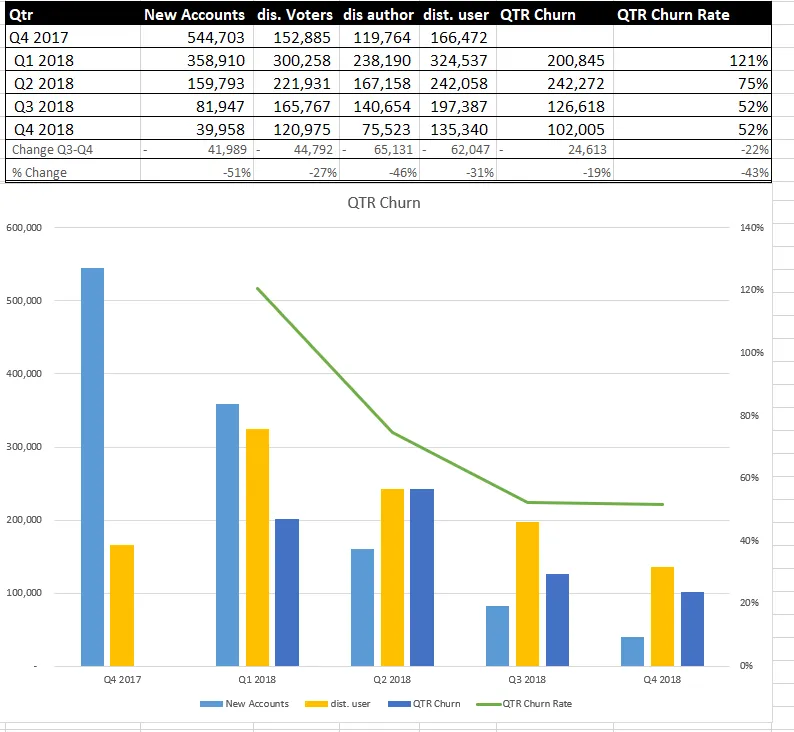
The table and chart above shows quarterly churn where New accounts includes ALL new registered accounts. We can see that the churn rate levels off at 52% for both Q3 and Q4. The general trend for the year seen a reduction in churn.
The average quarterly churn rate was 75% and the median 63%
Below shows churn where new accounts only include accounts that because actively socially by either/or voting/ commenting
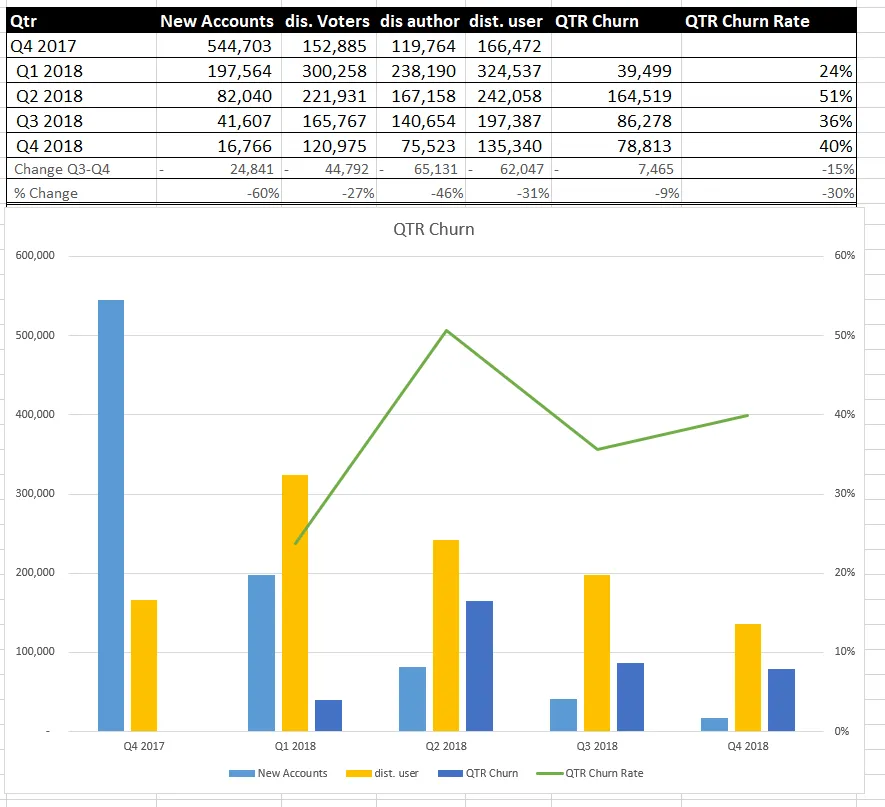
Although the churn rates are considerably lower using only accounts that because social as new accounts, This shows a different trend where by the trend for the churn rate over the year is an increase.
The average churn was 37% and the median is 38%.
Conclusion
Looking at STEEM as a social type platform, it would be my opinion that only including new accounts that became active on the social side is a fair representation of churn on steem as a social platform. Some accounts are wallet holders (accounts with active transfers in or out of the wallet and no social actions), some accounts never had any activity at all. Therefore, there is justification for excluding these accounts from the calculations when looking at churn from a social aspect.
However, it is worth pointing out, accounts that have ONLY JSON transactions (such as steemmonster players) would be included in accounts that never posted or voted.
It is also worth pointing out the HF20 happened late September, so was in full effect for Q4. In the next churn report I will have enough data to compare the churn rates with different sign up routes such as via Steemit Inc or Utopian.
The Data and the queries
As mentioned I used Steemsql and PowerBI to gather and model the data. The query used to get the unique voters was
SELECT voter, timestamp FROM Txvotes (NOLOCK) where timestamp >= CONVERT(DATE,'2018-10-01') and timestamp< CONVERT(DATE,'2019-01-01')With the data returned from this query, a distinct count of voter (for both month and quarter) was calculated.
The query used to get the unique authors was
SELECT author, timestamp FROM Txcomments (NOLOCK) where timestamp >= CONVERT(DATE,'2018-10-01') and timestamp< CONVERT(DATE,'2019-01-01')With the data returned from this query, a distinct count of author (for both month and quarter) was calculated.
To get the total unique users, I combined both of the above queries and then ran distinct counts on the name.
The query used to get the number of new accounts was
Select name, created FROM Accounts (NOLOCK)However, this query only gives ALL new accounts. To get the distinct counts of new accounts that posted and or voted I used data from a different report. This is the monthly new user report that is published on steem under my account.