
Churn and retention are facts of business. You will win new users and you will lose users. Churn measures how many users you are losing. Whereas retention measures how many users you are keeping. Churn can be calculated by the following formula
Churn = Number of Active users at the beginning of the period + New registrations – Number of Active users at the end of the period.
Churn rate can be calculated using
Churn rate = Churn / Number of Active users at the beginning of the period.
A high churn rate on a social media/networking site would indicate low engagement lack of loyalty and high dissatisfaction. To give us some sort of base to use as a benchmark for STEEM, I have taken this chart from vertoanalytics.com

Repository
https://github.com/steemit/condenser
Aim of Analysis
The aim of this analysis is to calculate the churn rate on STEEM as a social networking type blockchain* for Q1 of 2019 and compare this to the previous 12 months
*STEEM is not only used a as a social networking type blockchain. Some people are investors and wallet holders only. Therefore, I have taken figures for all new registered accounts and I have also taken figures for those that have either poster or voted or both and excluded those that have not.
I also wanted to look at different account creation routes to see if there is any difference in retention from route to route.
All data for this analysis was taken from Steemsql held and managed by @arcange. As to not distract from the data, I will first present the findings and then the queries used.
Monthly Churn
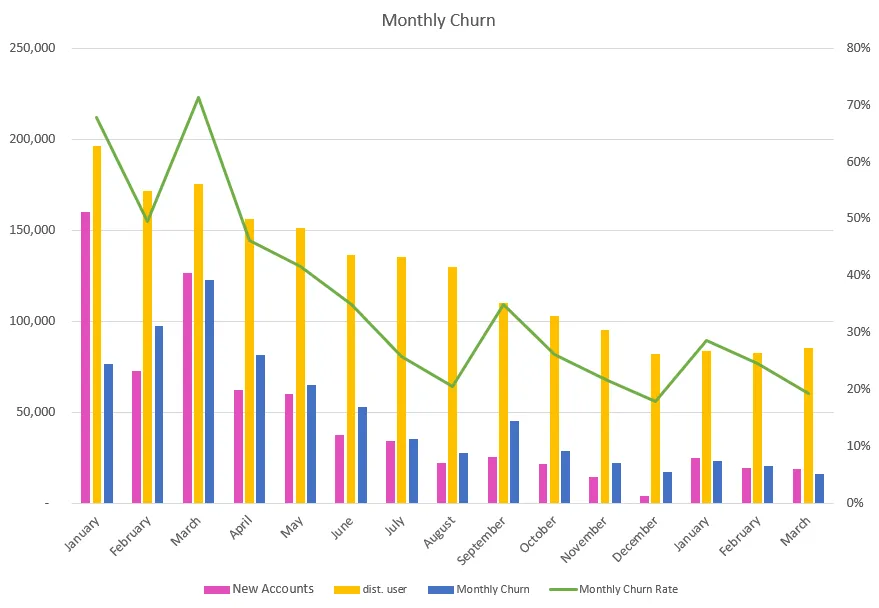
The table and chart above show the monthly churn and churn rates including ALL registered accounts as new accounts, no matter what their actively level on the block.
It is clear to see from this that the churn increased in January to reduce again in February and March. This increase may have been down to the backlog of accounts from December that were set up in January.
The average monthly churn rate for 2018 was 39% and the median is 35%. The average monthly churn for the first 3 months of 2019 was 24% and median 25%
Not all accounts became active in a social sense. Some accounts are just wallet holders. To reflect this the table and chart below have an adjusted in the new account’s column. This column now only includes accounts that have either voted or posted. Churn and churn rates are calculated the same as above.
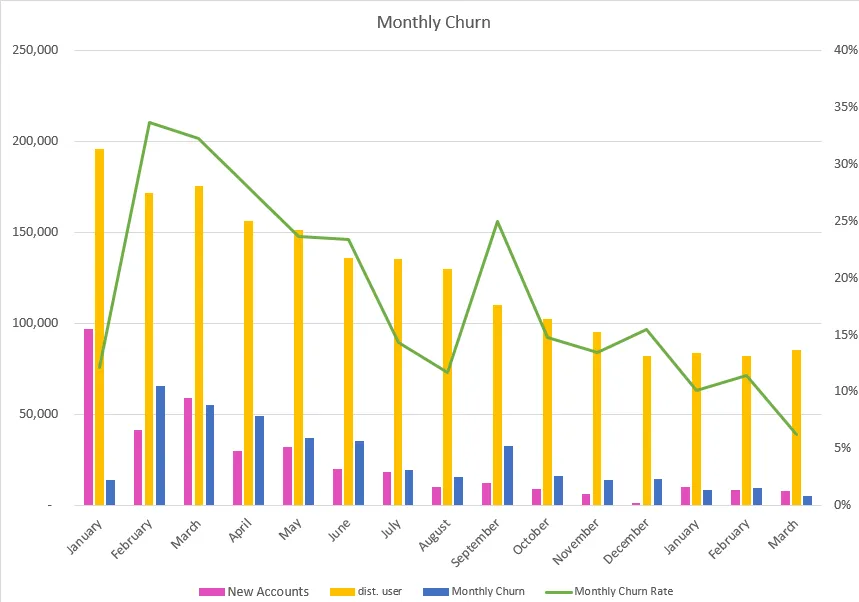
From this we can see the reduction in churn rate seen during 2018 continued into the first 3 months of 2019. A churn rate of only 6% was recorded for March.
The number of distinct users has been increasing since December with March seeing the highest number of distinct users in the last 4 months. This coupled with the lower new (socially active) accounts resulted in a very low churn rate.

courtesy of @arcange
All in all, monthly churn rates when you only include accounts that either/or post/vote show a lower churn than that including all accounts.
The average monthly churn rate calculated this way was 9% and the median was 10%.
Quarterly Churn
Month on month churn is not the most effective measurement as a user might not be active one month but become active again the next month. Therefore a better way to calculate churn is on a quarterly basis.
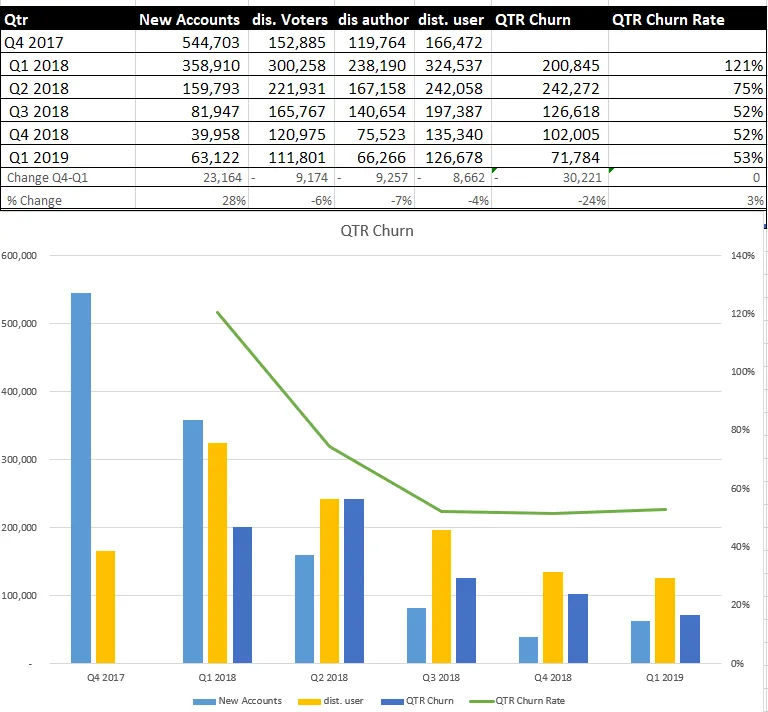
The table and chart above show quarterly churn where New accounts includes ALL new registered accounts. Q3 & Q4 of 2018 showed churn levelling off. However, Q1 of 2019 shows a slight increase in the churn rates from 52% to 53%.
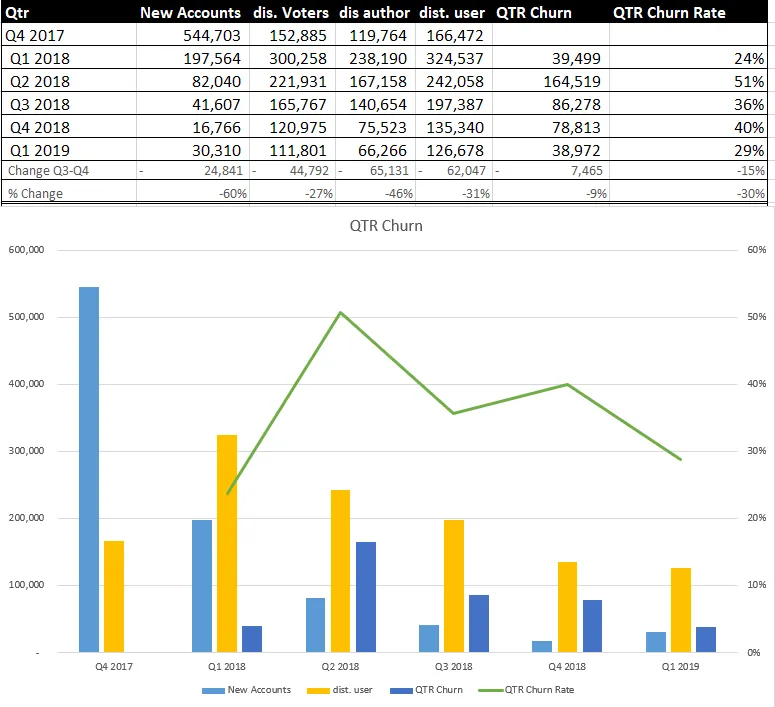
The table and chart below show quarterly churn for socially active accounts. Although we seen an increase of 60% in the number of new socially active accounts in Q1 2019 over Q4 in 2018, we also see a further drop in the number of distinct voters and authors. However, as the drop in distinct users was not as severe as the increase in new active accounts, we see an overall drop in churn for Q1 to only 29%.
Retention by Creator
HF20 introduced methods to create accounts with account creation tokens, or by burning Steem, Opening up the doors to alternatives to Steemit Incs account creation service.
With this in mind I took a dive into drop offs to see who was retaining the most users they created.
Since the 1 October 18 Steem has 104K new accounts. Of this almost 16K, or 15.2% were active in the last 14 days.
Looking at social activity, as in those that posted or voted, 41.8K new accounts became active between 1 Oct and 31 March. Of this 37.76% were active in the last 14 days. This 37.76% represent retention of accounts set up during this period only. This would suggest a churn on new accounts since October of 62.24%
The average drop off day for accounts that were not active in the last 14 days is 27.49 and the media is 14.
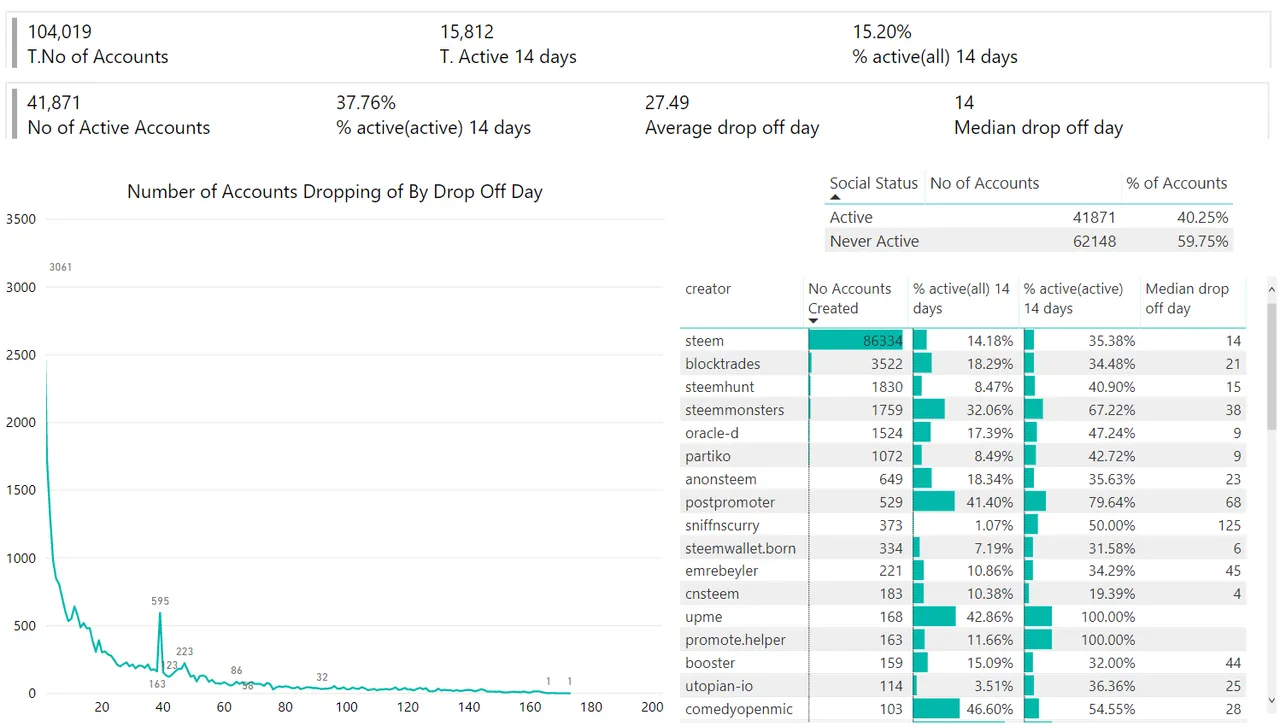
The line chart represents the drop off day for accounts that were set up during this 6-month period and the table beside that shows details per account creator. Steemit Inc being the largest account creator retained 35% of all accounts that became active, with the median drop off day for the remaining 65% being 14. @steemmonsters retaining 67%, @blocktrades 34%, @steemhunt 41%, @oracle-d 47% and @partiko 42%. @comedyopenmic also looks good in there with over 46% of new accounts becoming socially active and retaining 54% of them.
Conclusion
Looking at STEEM as a social type platform, it would be my opinion that only including new accounts that became active on the social side is a fair representation of churn on steem as a social platform. Some accounts are wallet holders (accounts with active transfers in or out of the wallet and no social actions), some accounts never had any activity at all. Therefore, there is justification for excluding these accounts from the calculations when looking at churn from a social aspect.
However, it is worth pointing out, accounts that have ONLY JSON transactions (such as steemmonster players) would be included in accounts that never posted or voted.
Although overall churn rates are dropping, the churn calculations factor in accounts from all time. Therefore I feel the churn calculated on new users since October only, based on 6 months with activity in the last 2 weeks of 62% to be a more reflective position of churn on steem.
It's interesting to see the retention by creator and it's awesome to see the %s for @comedyopenmic.
The Data and the queries
As mentioned I used Steemsql and PowerBI to gather and model the data. The query used to get the unique voters was
SELECT voter, timestamp FROM Txvotes (NOLOCK) where timestamp >= CONVERT(DATE,'2019-01-01') and timestamp< CONVERT(DATE,'2019-04-01')With the data returned from this query, a distinct count of voter (for both month and quarter) was calculated.
The query used to get the unique authors was
SELECT author, timestamp FROM Txcomments (NOLOCK) where timestamp >= CONVERT(DATE,'2019-01-01') and timestamp< CONVERT(DATE,'2019-04-01')With the data returned from this query, a distinct count of author (for both month and quarter) was calculated.
To get the total unique users, I combined both of the above queries and then ran distinct counts on the name.
The query used to get the number of new accounts was
Select name, created FROM Accounts (NOLOCK)However, this query only gives ALL new accounts. To get the distinct counts of new accounts that posted and or voted I used data from a different report. This is the monthly new user report that is published on steem under my account.
The query used to get the accounts creator was
Select * FROM txAccountcreates (NOLOCK)