Link to the github repository
https://github.com/steemit/steem
1. INTRODUCTION
The delegation of VESTS represents the support (altruistic or interested ) to other accounts (personal or projects) so that they have more Steem Power which, as we know, provides more influence and the possibility of generating more rewards.
Depending on the activities and results of those accounts to which the VESTS have been delegated and also taking into account the circumstances of the kryptos-Steem ecosystem in the subsequent months, the received support can be maintained, withdrawn or increased.
This process of (1) support, (2) waiting for results and (3) evaluation of the results is repeated over time in periods of different lengths .
Previous analyzes made by other users
- Delegation Users & Trends created 11 months ago by @steemitph
- Analysis of recent @steem (un)delegations created 9 months ago by @crokkon
As these previous contributions focus on the Top Delegators and Delegatees accounts and on the undelegations from @steem, my objective is to show an overview of the evolution of delegations and undelegations with special interest in showing which is the state of the delegations in the present moment.
2. TABLES
I used Steem SQL to obtain the data presented in this analysis. There are two tables that I used to make the queries.
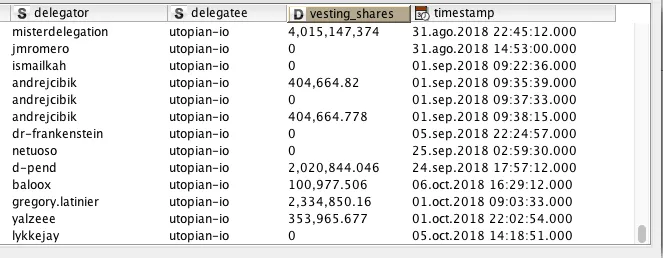
TxDelegateVestingShares
SELECT
delegator, delegatee, vesting_shares, timestamp
FROM
TxDelegateVestingShares
The contents of this table represent the updates of the delegated VESTS (delegations and delegations) indicating the updated amount, the delegator and the delegatee involved in the update.
Example using:
delegatee = "utopian-io"
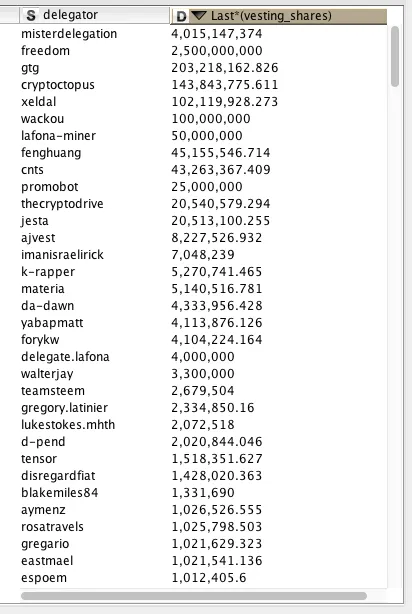
To know the total value of delegated VESTS for a certain delegatee/delegator (at a certain moment) , we must add the last update (at that certain moment) for all its delegators/delegatee.
Example using :
delegatee = "utopian-io"
timestamp: 05-Oct-2018

VOReturnVestingDelegations
This virtual operation occurs when the vesting_shares (or Steem Power) that has been previously delegated by an account to another account comes back the the original owner.
SELECT
account, amount, timestamp
FROM
VOReturnVestingDelegations
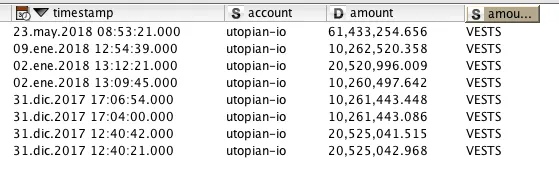
In this example @utopian-io has a delegator roll and therefore represent the withdrawals that the @utopian-io account has recovered from previous delegations.
3. ANALYSIS
What has been the evolution of the number of updates in the delegation?
Unique count (ID)
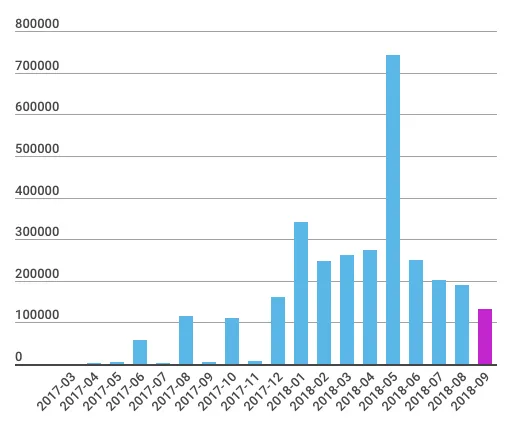
- In recent months the trend in the number of updates has been decreasing since a "strange" maximum occurred in 2018-05.
What has been the evolution of the accumulated amount of delegated VESTS?
The following graph represents the amount of VESTS that was effectively delegated at the end of each month. VESTS are in Steem Power(k)
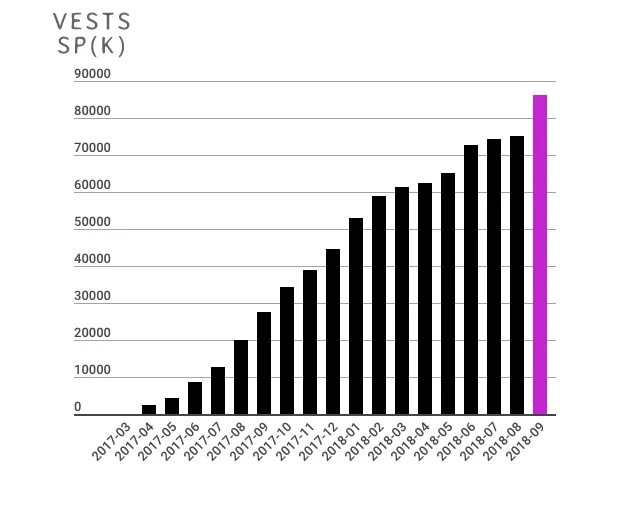
Observing the evolution of the amount of delegated VESTS we see that it has been growing month by month throughout all the period. The highest growth occurred in the recent month of 2018-09 reaching an approximate value of 86 M VESTS (SP)
Regarding the strange peak in the number of updates in 2018-05 we see that it is not accompanied by a change in the number of accumulated VESTS in that month compared with the near months.
What monthly amounts of VESTS were Delegated and Undelegated ?
Resulting = Delegated- Undelegates R= D - U
By calculating the 'derivative' (difference between consecutive values) of the data in the previous graph we can know the Resulting (R) amount of VESTS involved in the monthly delegations/undelegations.
R - Resulting
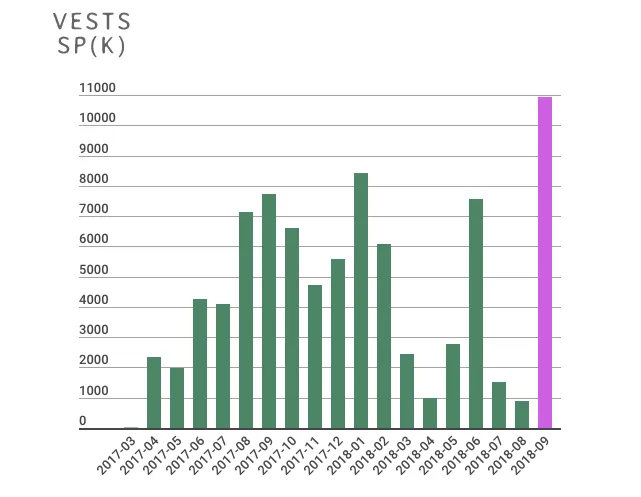
- In this graph we can see more clearly the abnormally high value in the resulting amount of delegated VESTS in 2018-09.
Evolution of the Undelegated VESTS
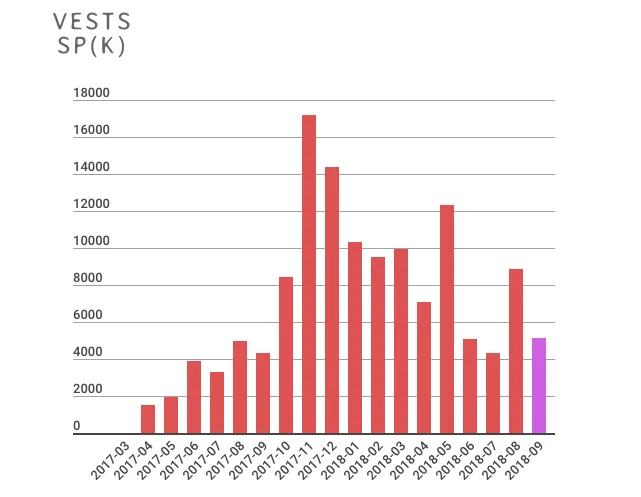
- Taking advantage of the information in the table *VOReturnVestingDelegations of the (U) Undelegated VESTS we can also know the amount of (D) Delegated VESTS .
D= R + U
Evolution of the Delegated / Undelegated VESTS
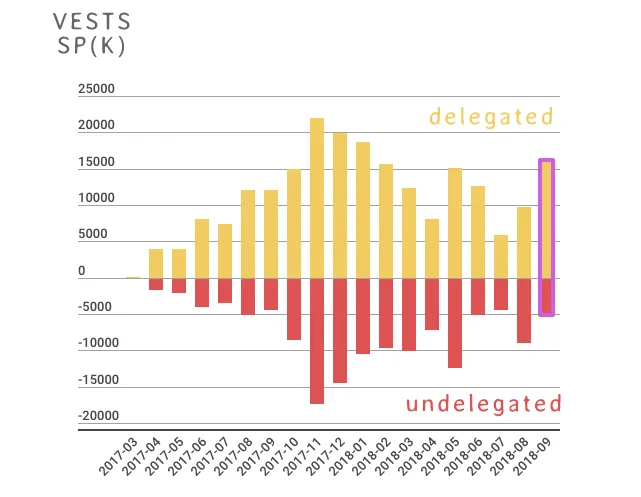
In this chart I have represented the amounts of delegated VESTS in yellow and positive and the amounts of undelegated VESTS in red and negative.
So, the last increase in the cumulative amount of delegated VESTS in 2018-09 is therefore due to a comparatively LARGE amount of DELEGATED VESTS and a comparatively SMALL amount of UNDELEGATED VESTS in 2018-09.
All the trends simultaneously
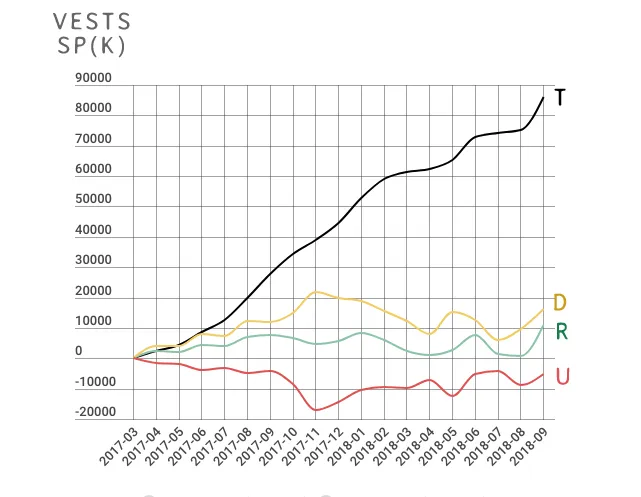
Observing all the trends simultaneously we could say that:
In 2018-09 the accumulated amount of delegated VESTS has grown substantially due to the fact that the number of delegated VESTS has increased and the amount of undelegated VESTS has decreased.
However, this increase compensates for a certain growth relaxation in the previous months to reach a number of accumulated delegated VESTS that have been growing in a very stable way throughout the history of Steem.
I was surprised to find such stability in the growth of the accumulated delegated VESTS. I interpret it as a sign of constancy in action.
Analysis of users: DELEGATORS and DELEGATEES
Throughout all the period, the number of unique delegators and delegatees have been:
- 22,021 delegators
- 984,730 delegatees
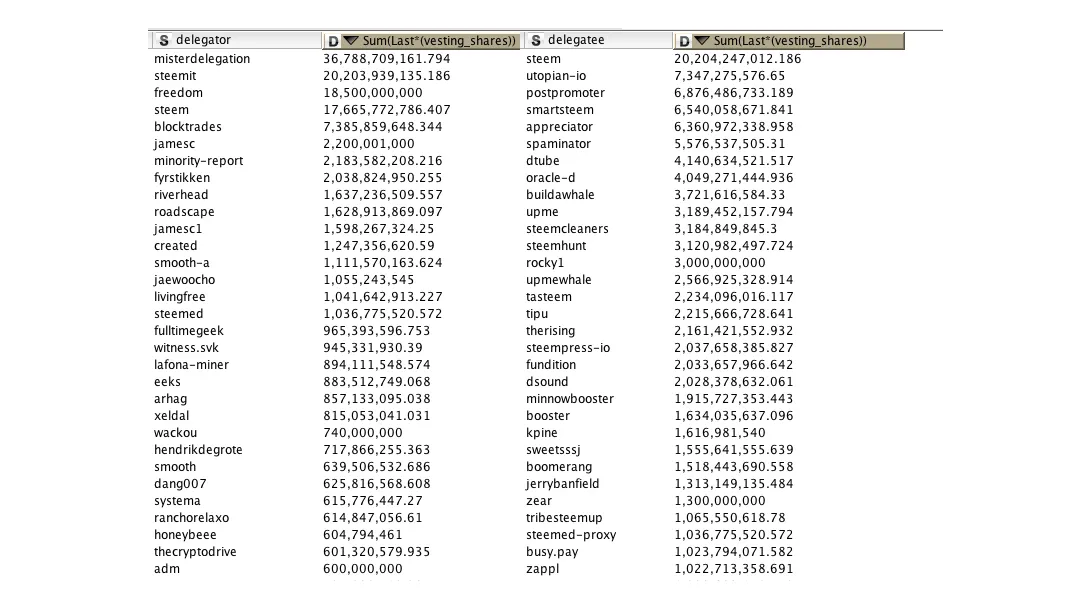
TOP accounts
The accounts that currently handle the largest amounts of VESTS, such as delegators and delegatees, are summarized in the following table.
Monthly evolution of the number of delegators who made updates
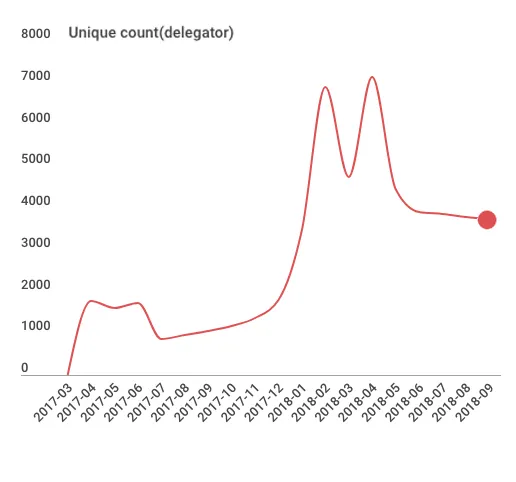
The highest peaks occurred in 2018-02 and 2018-04 with around 7k delegators.In the last months it has stabilized in a value of medium magnitude around 3.8k.
Monthly evolution of the number of affected delegatees
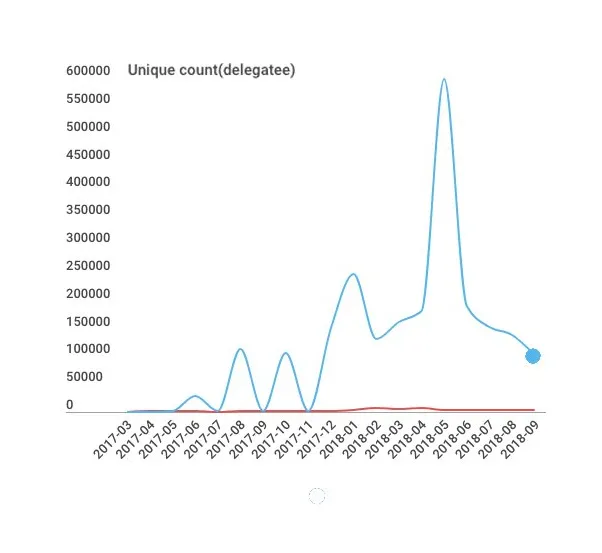
It shows a great variability with values between 1 k and 597 k. This last maximum value occurred in 2018-05 from which it has decreased to the value of 100k in 2018-09.
Here seems to be the cause of the strange peak in the number of updates of the delegations in 2018-05. That is, in that period updates of delegated VESTS were made to an abnormally high amount of delegatee-accounts.
N. Delegatee / N.Delegator RATIO
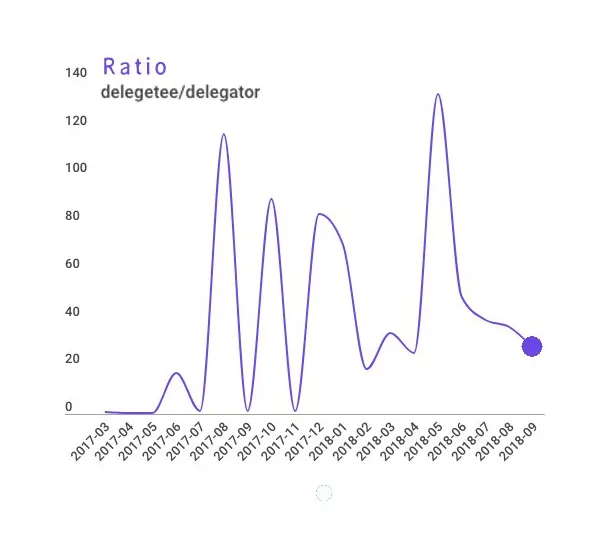
Here you can clearly see the variability of the evolution of the ratio between delegatees/delegators that has had several of those high peaks reaching (130: 1) in 2018-05 currently standing at an approximate value of (30: 1).
This would indicate different phases in the behavior of the delegators as I indicated at the beginning as (1) Update support, (2) waiting for results and (3) evaluation of the results, Go to (1).
Average amounts of delegated VESTS (SP (k)) per user
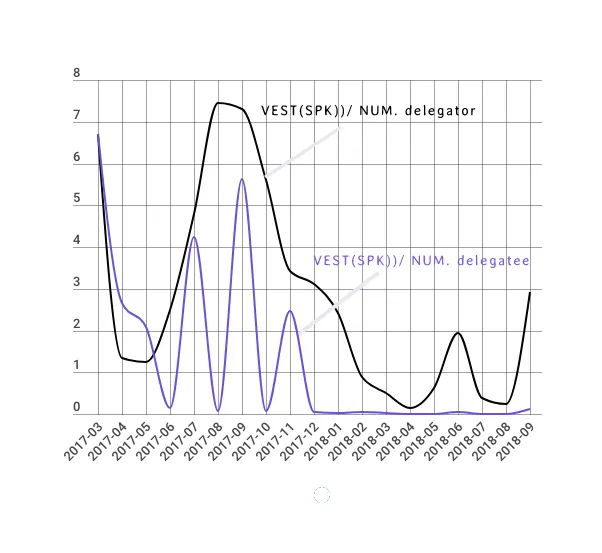
The average amounts of VESTS delegated by delegators and those received by delegates can give an idea of the type of relation between accounts.
When both ratios are high (delegators are delegating large amounts of VESTS and delegates are also receiving great averages) can be interpreted as moments of support/investment in project-accounts and we see that there were three major waves of this trend but all of them before 2017-12.
After this date the delegatees have received much smaller average quantities that can be interpreted as support/investment more in personal-accounts
Therefore, in the peaks of 2018-06 and 2018-09 there seems to be a trend in the form of waves of support/investment in personal-accounts in the form of delegated VESTS.
4. DATA SOURCE, DATES and TOOLS
DATA SOURCE
I have used SteemSQL, a publicly available Microsoft SQL database containing all the Steem blockchain data held and managed by @arcange.
DATES
- Data extraction 2018-08-5
- Submitting date 2018-11-10
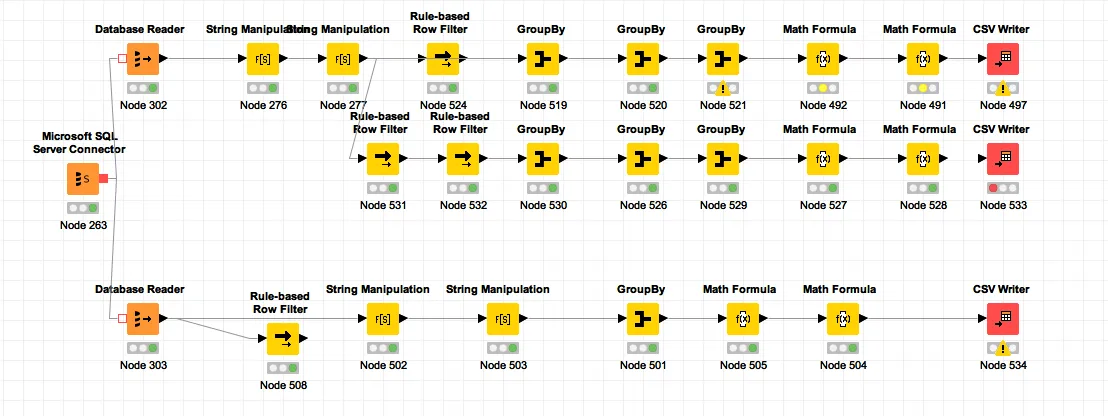
ANALYSIS TOOL
I have used KNIME, a free and open-source data analytics, reporting and integration platform, to get, filter and manipulated data
KNIME WORKFLOW