

4 Reasons Why Bitcoin Is Now Retesting November Lows — $6.4K Next?
The following charts are an update to charts I posted in my prior comment post of this comment thread.
Click here to zoom and read my extensive and very important commentary about the following charts:
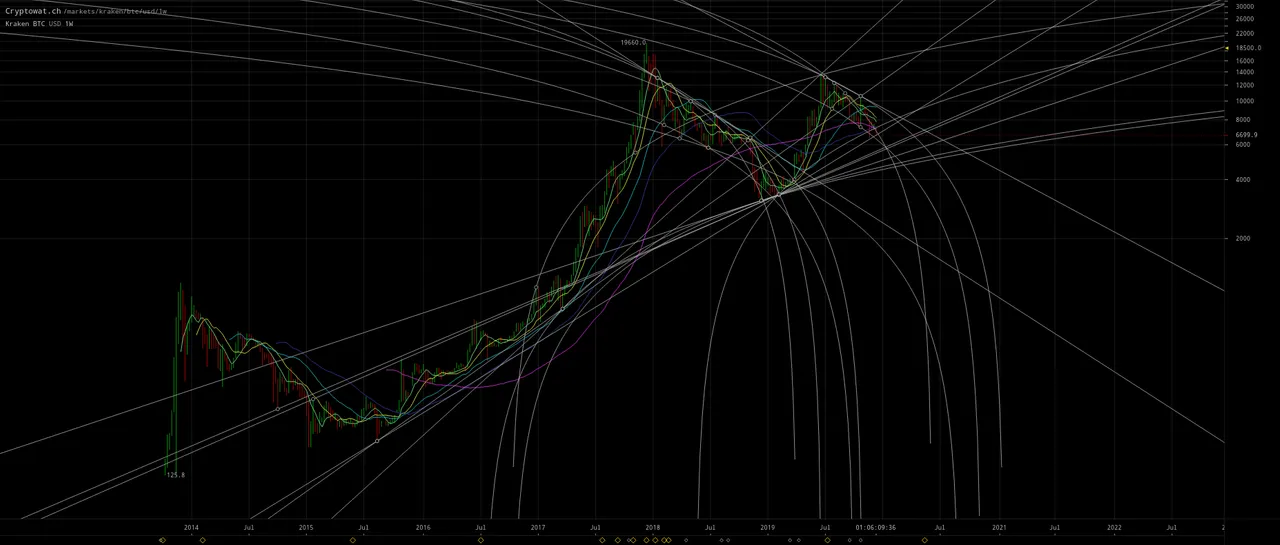
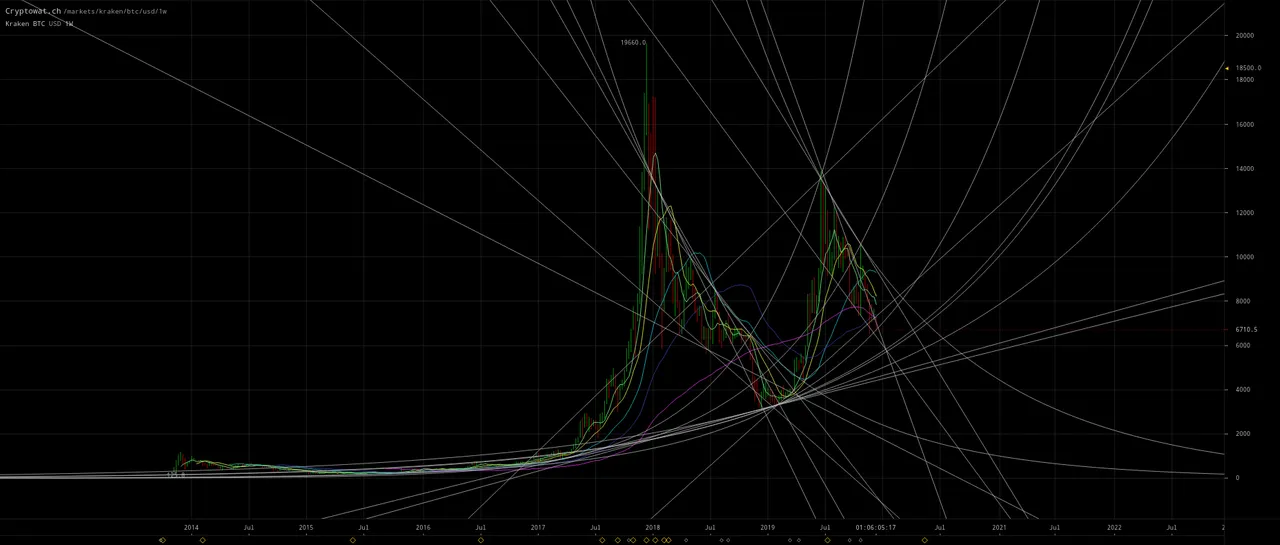
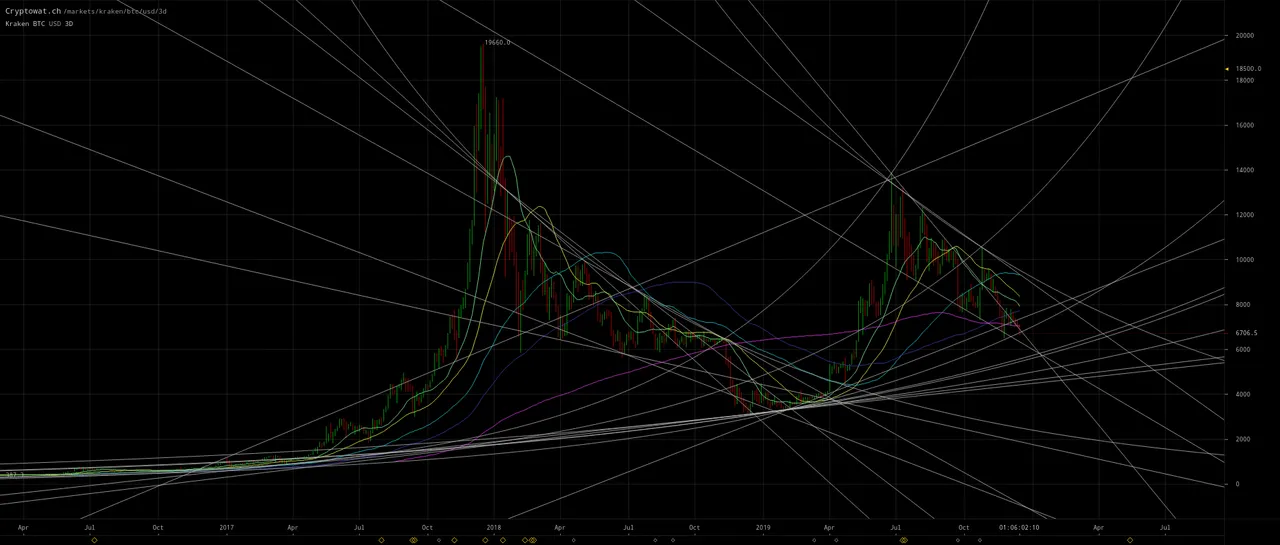
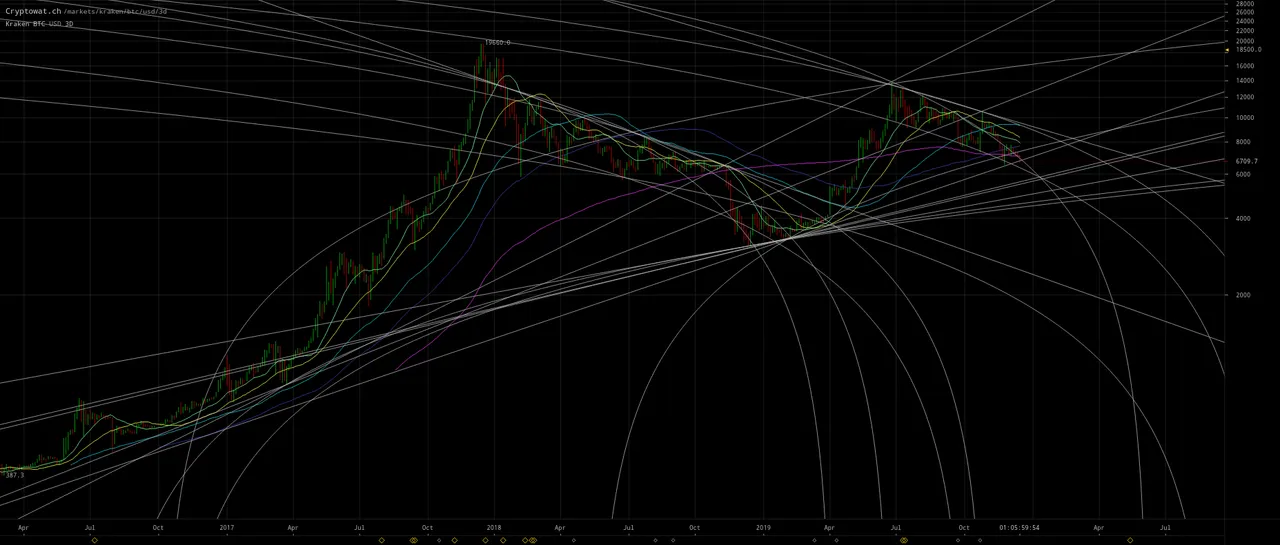
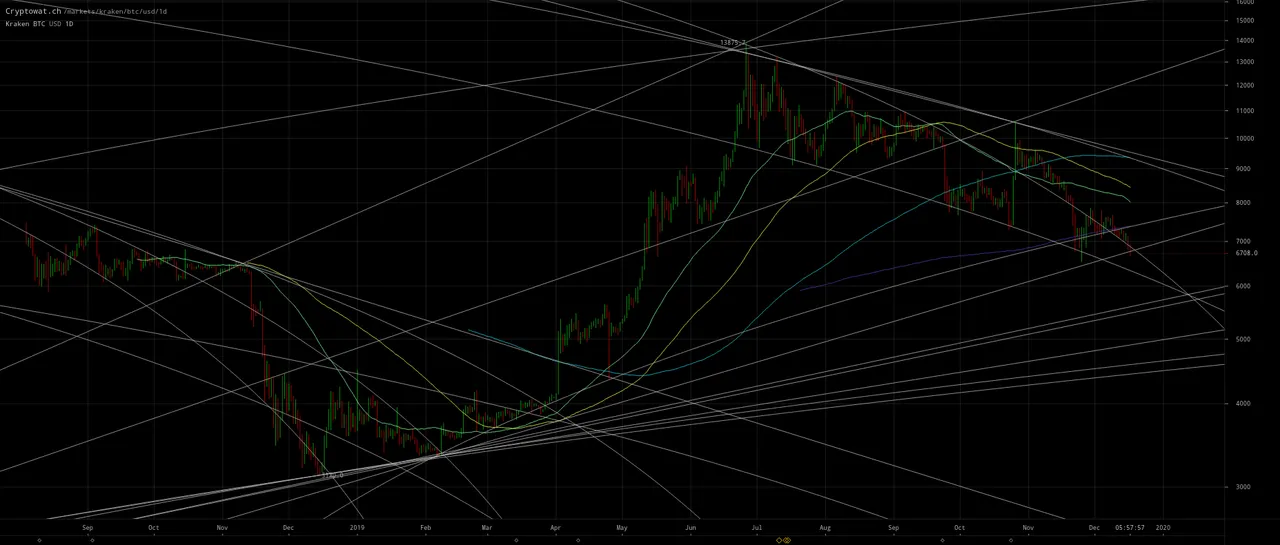
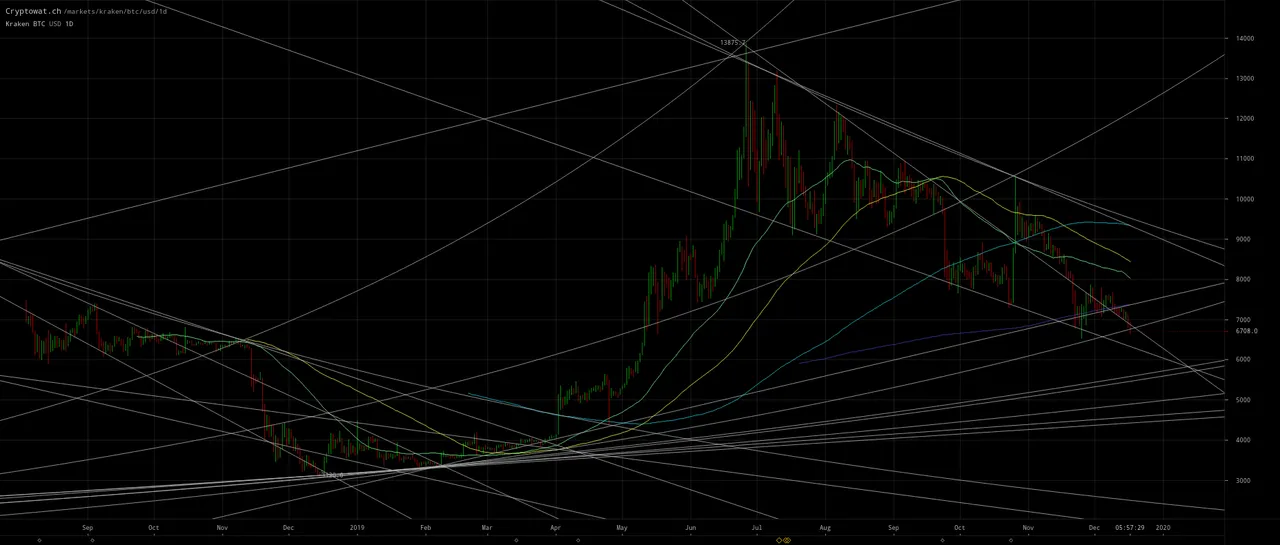
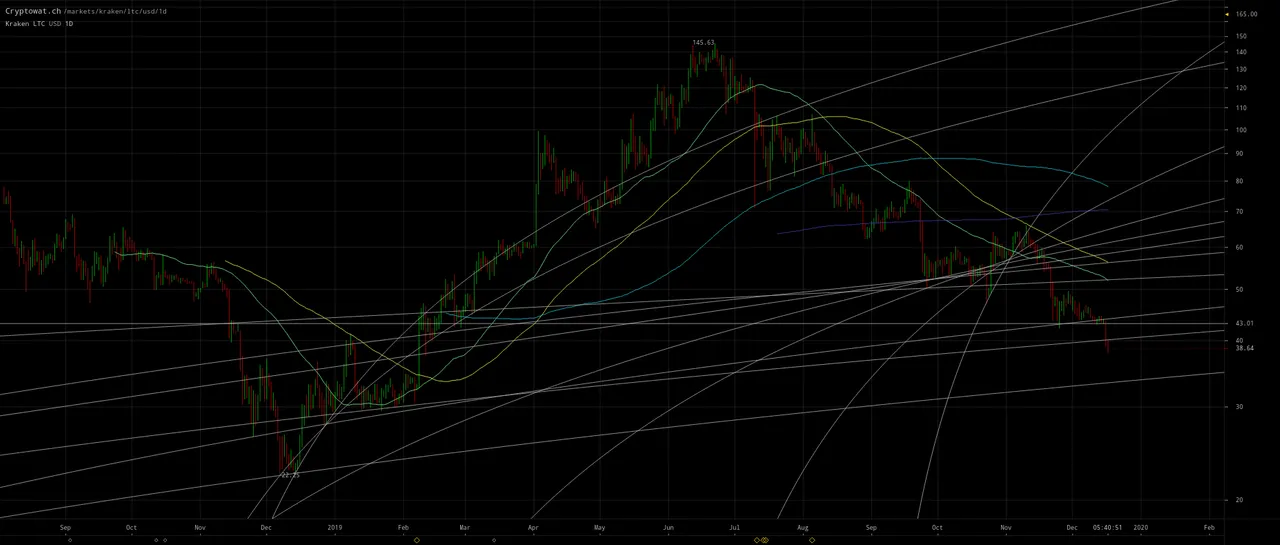
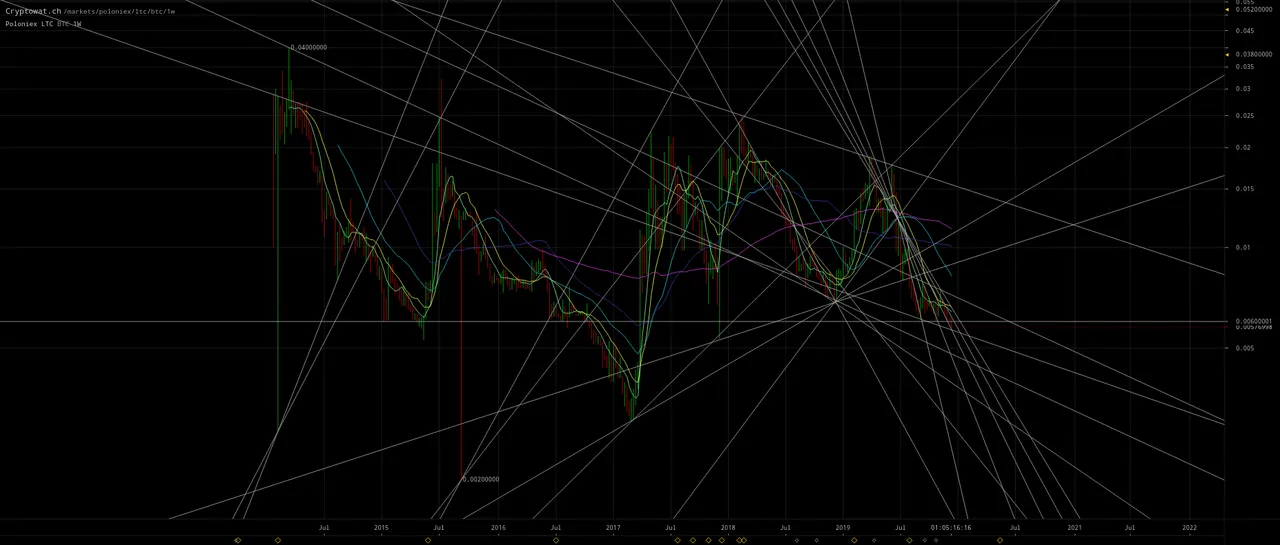
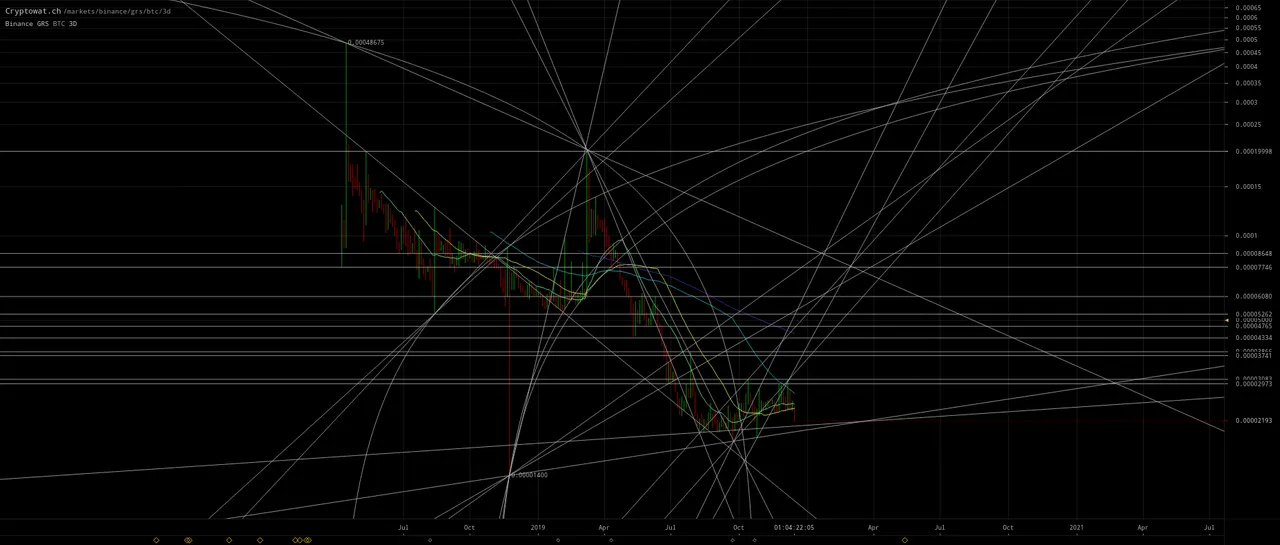
(click to zoom to source & to read commentary)
As of December 16, @filbfilb remains poised to reload bullish above $6k as he explained in his recent article Is Bitcoin Now Bullish or Bearish at $7K? Here’s the Scorecard:
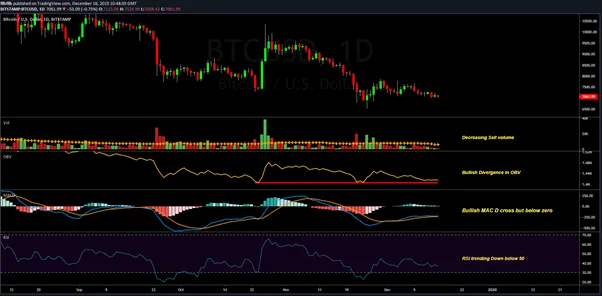
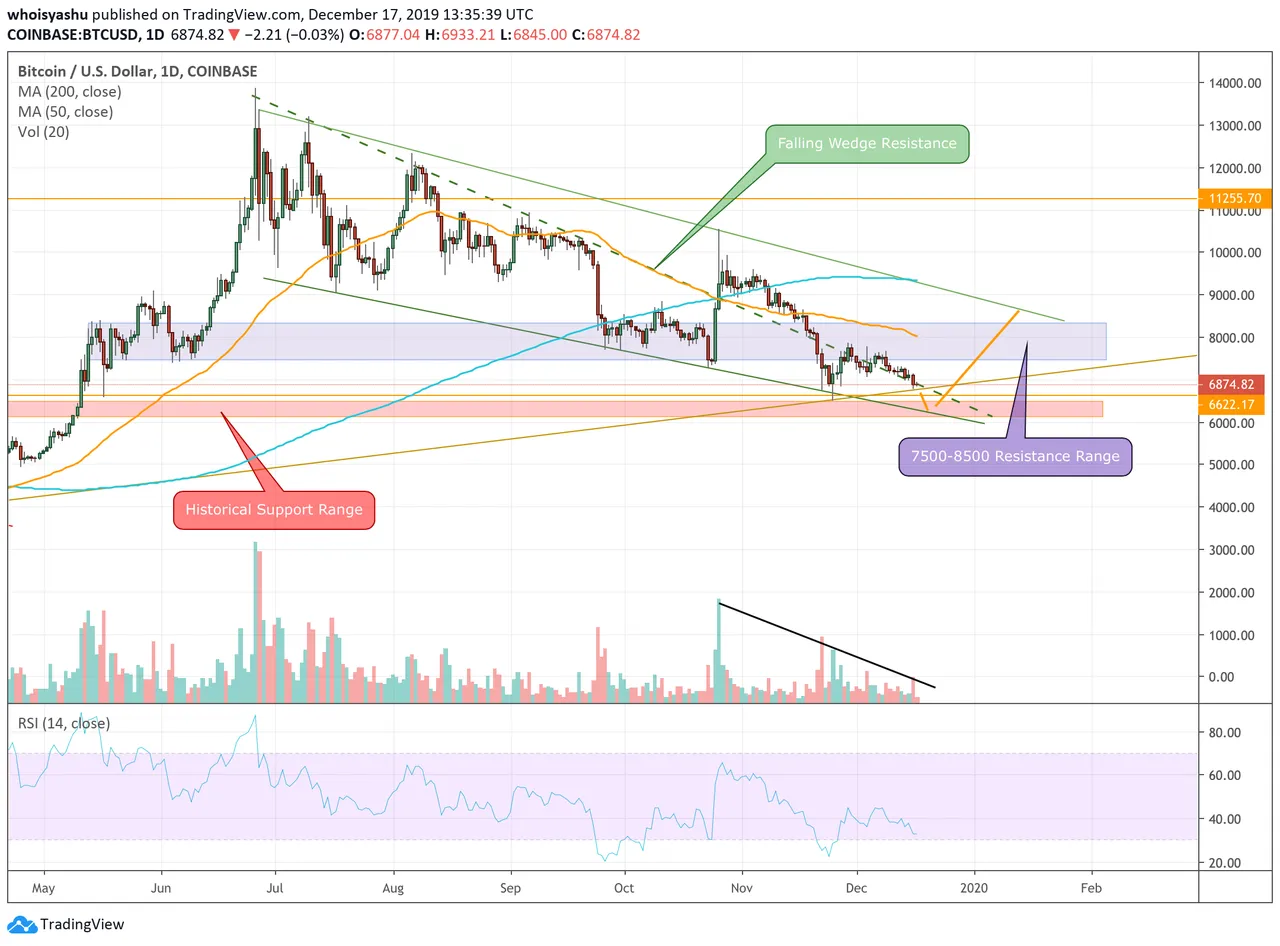
- The [RSI] trend appears to be weakening to the downside but is too early to call bullish — neutral
- Volume has been decreasing since June — in a downtrend, this is typically viewed as bullish
- OBV has flattened out, illustrating that cumulative volume to the downside is losing momentum but currently no bullish divergences or breaks to the upside — neutral
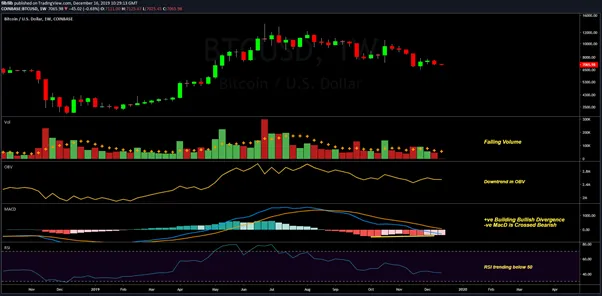
Weekly OBV and RSI declines are decelerating or bottomed analogous to the second retest of the bottom support line in January 2019. Also volume is declining likely indicating waning bearish selling. The weak hands have nearly completed their capitulation. Maybe one more small leg down to shake the trees of the few remaining retards who sell the bottom.
Weekly Conclusion -2: Bearish
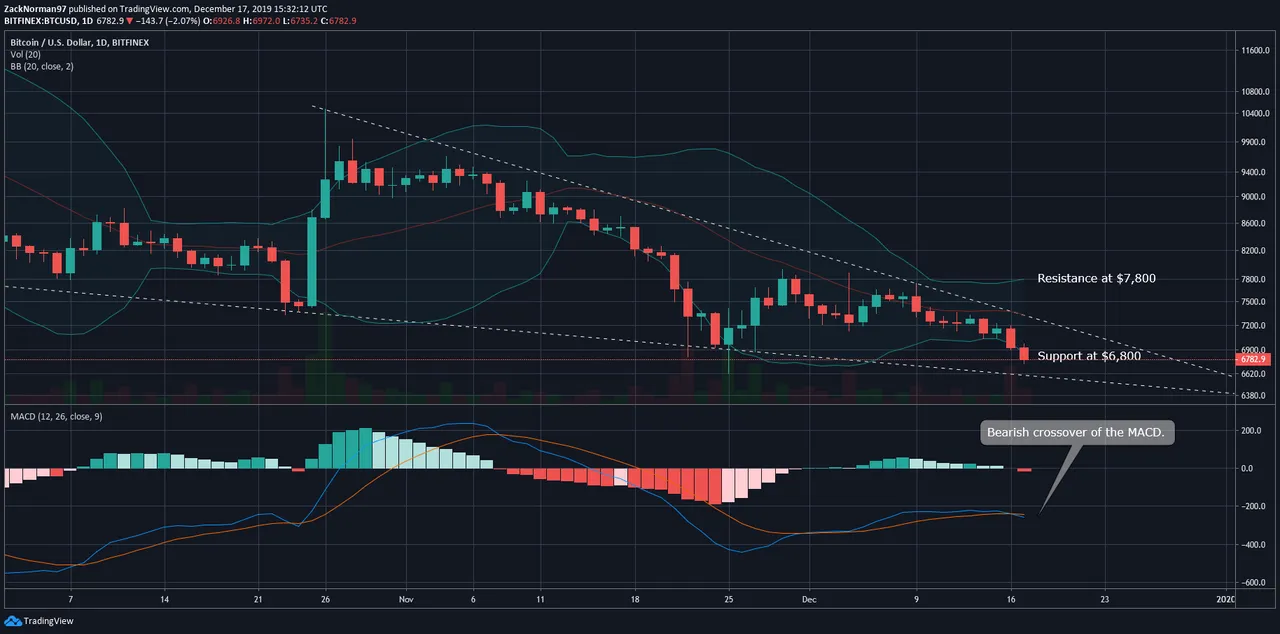
Overall, Bitcoin is up a significant amount year-on-year and, as such, it is not a surprise that long view moving averages are crossed bullish. Nevertheless, the momentum indicators in the RSI and MACD, which look at more recent price action, illustrate that momentum remains to the downside although it is starting to show signs of weakness. This weakening bearish momentum is also reflected in the declining volume.Overall, the weekly chart is conclusively bearish until there is a breakout in volume and a shift in price direction.
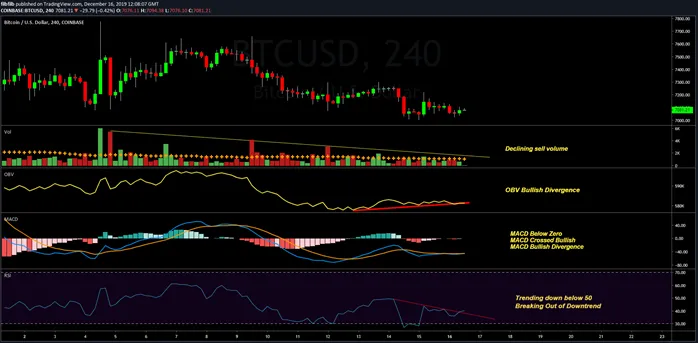
Bullish divergence in daily and 4-hour OBV with declining volume indicates a steady level of accumulation with declining dumping by panicked bears. The momentum is still bearish but weakening thus no massive surge lower seems plausible. A shake or two more of the trees to see which stranglers aren’t hodling tight and then should have a lurch up in bullish which should put an end to this 6 month correction.
Update: Peter Brandt tweeted the following (and somehow my tweet response linking to this post was deleted by Twitter but then later reappeared at a different url):
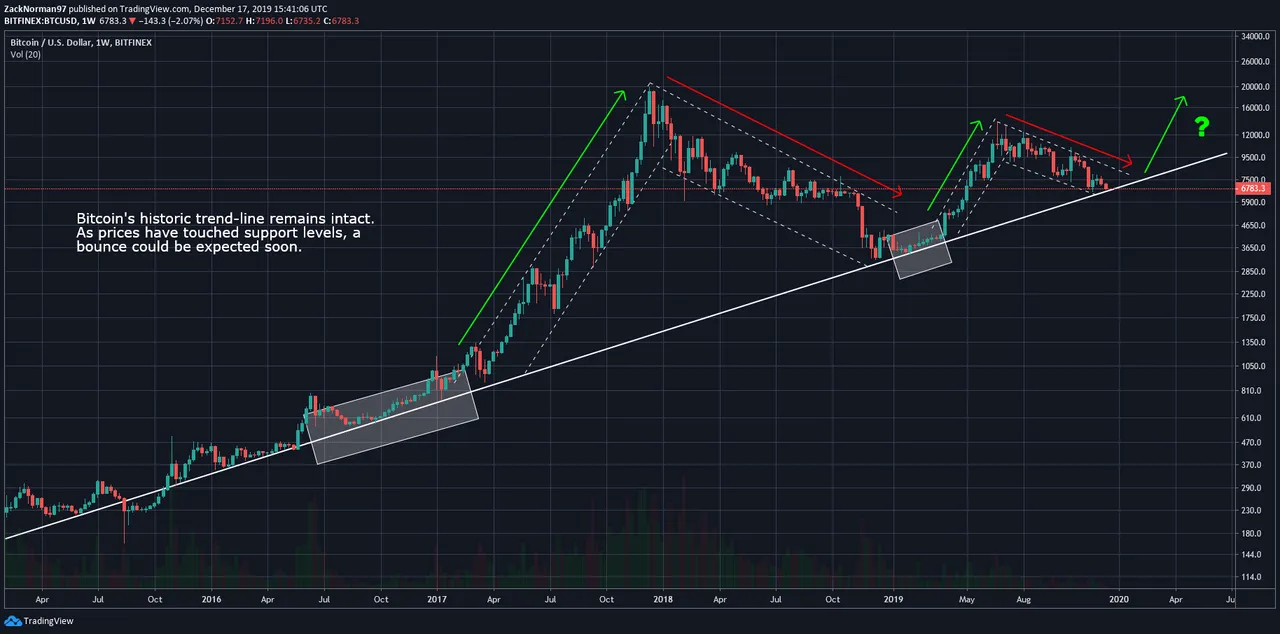
Bitcoin $BTC has apparently held at important support
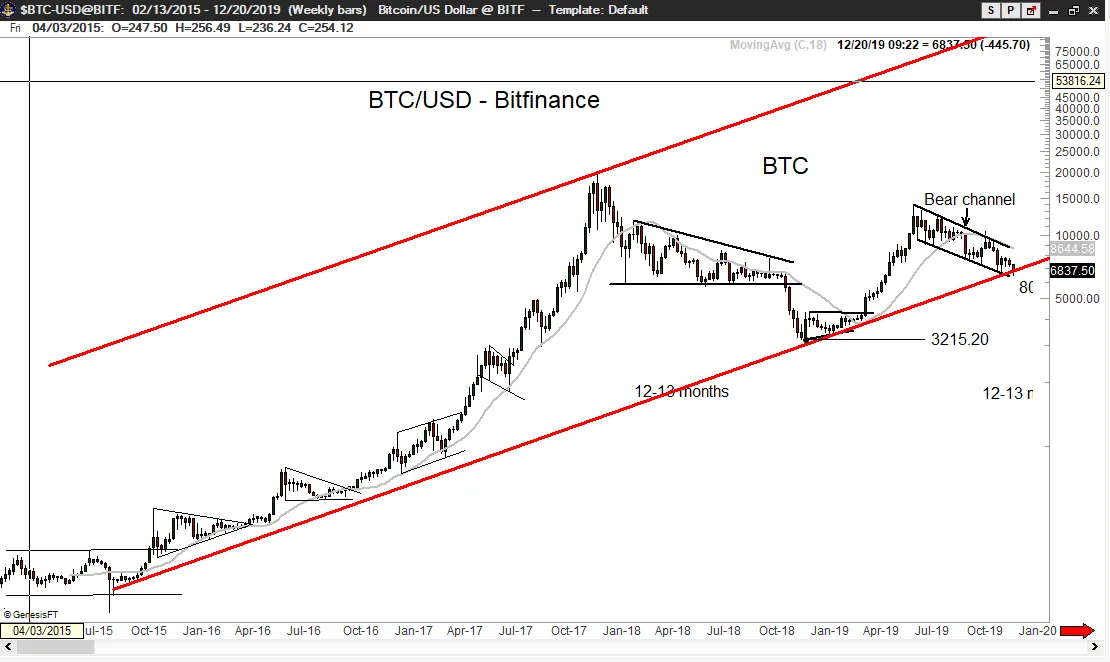
Also note that Bitcoin bounced up significantly on Dec. 18 as I had expected 14 days ago when I mentioned the usual Bitcoin Santa Claus rally. In private emails, I had mentioned either Dec. 16 or 18 as date for a whiplash low and significant bounce that would likely be the bottom.
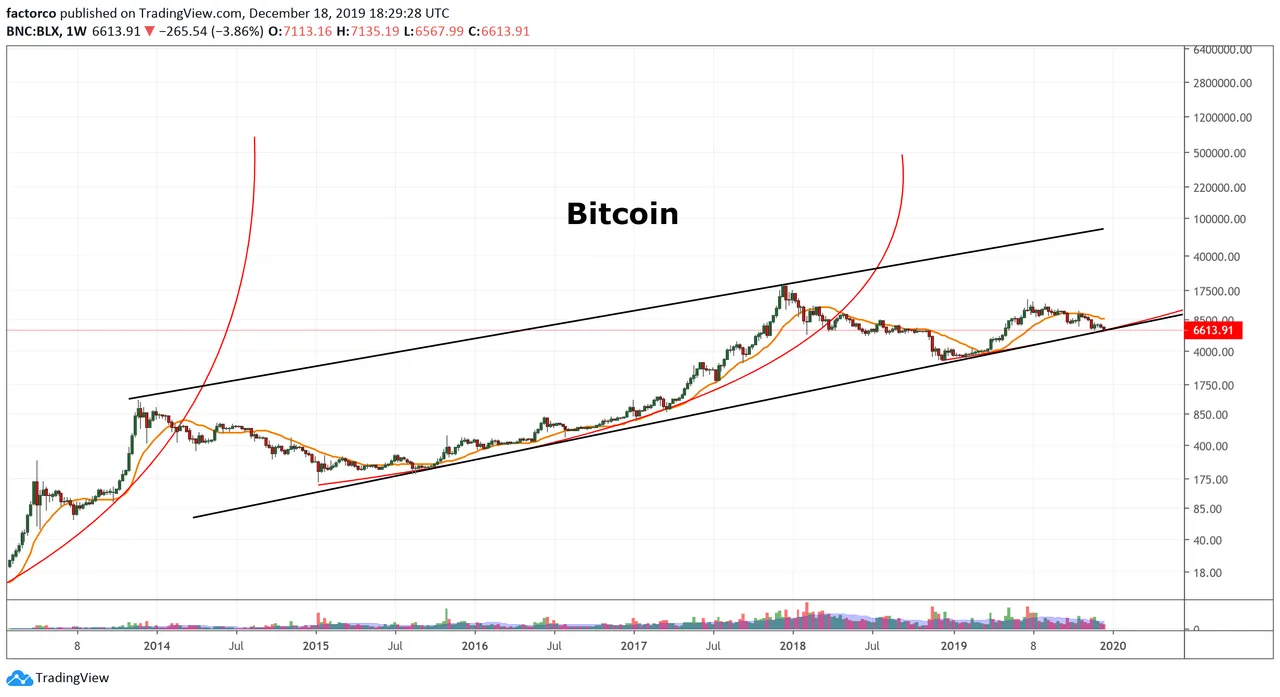
On Peter’s second chart above, note the similarity in structure of the pattern to the 2013 correction and then rocket launch into the ~$1200 ATH in late 2013. In my more recent blog Bitcoin to $80,000 before May 2020 and $1 billion by December 2020? I explained that’s why I’m expecting that rocket launch to kickoff in January.
Update #2: a new article How a Whale Crashed Bitcoin to Sub-$7,000 Overnight highlights both the PlusToken scam dumping which I had noted in my prior post in this thread @filbfilb had cited as a reason for the selloff. Also this new article has identified the same pattern I see for targeting the bottom:
Another more article Bitcoin's Correction May Soon End has more detailed analysis of these points:
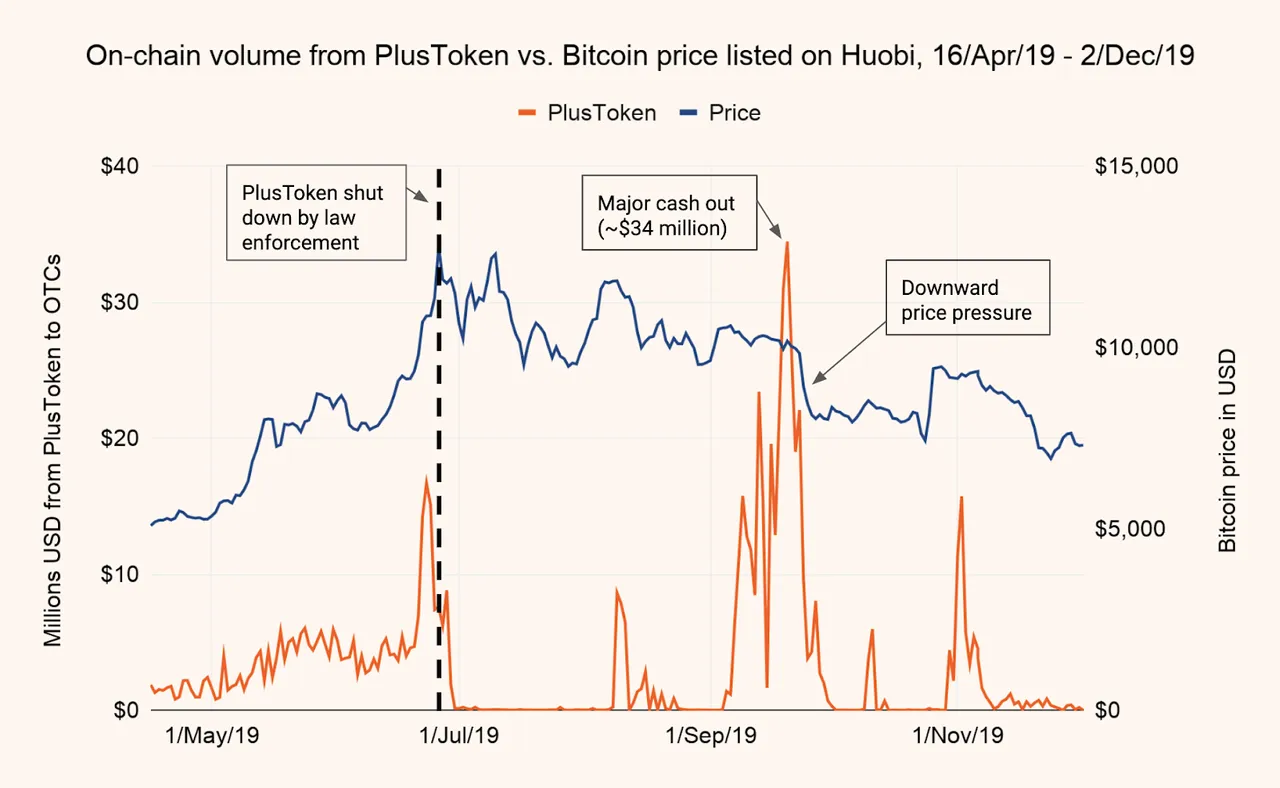
The mainstream media even picked up on this thesis in BusinessInsider’s article Bitcoin's slump may have been driven by a billion-dollar Ponzi scheme, miners cashing out, and a volume slump.
RE: Bitcoin’s Whiplash Bear Trap