
Hello friends of $LUV, Friends of $HIVE and all others,
here are the:
LUV Statistics for the last week:
The timeframe is from 2022/05/27 - 2022/06/03.
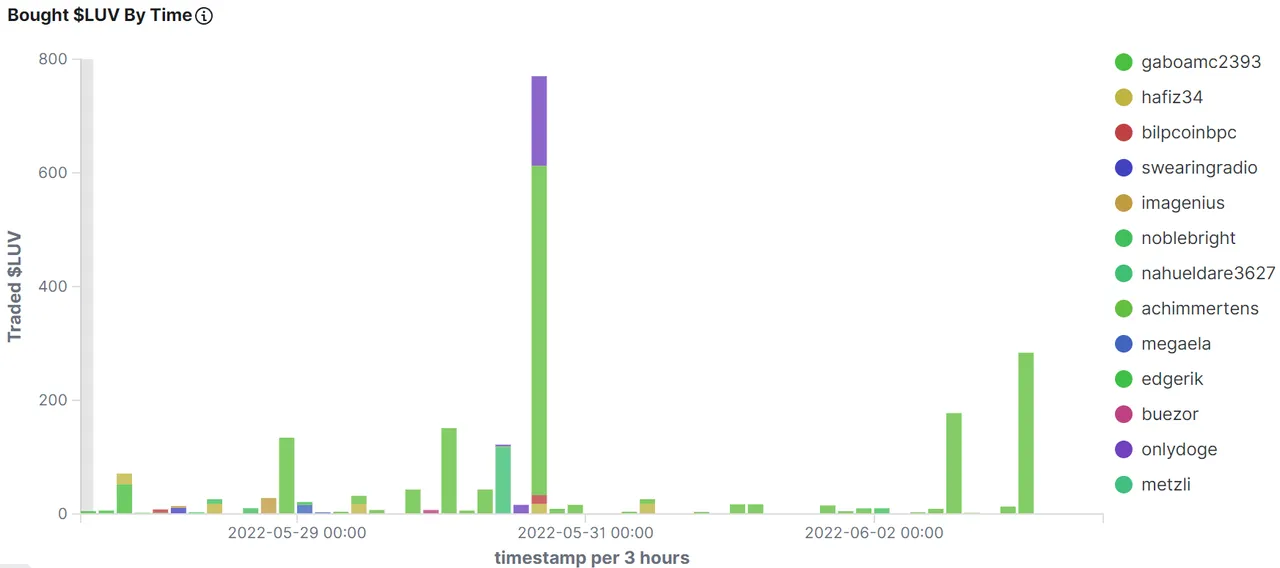
Bought $LUV By Time
This figure shows who has bought how many $LUV at which time:
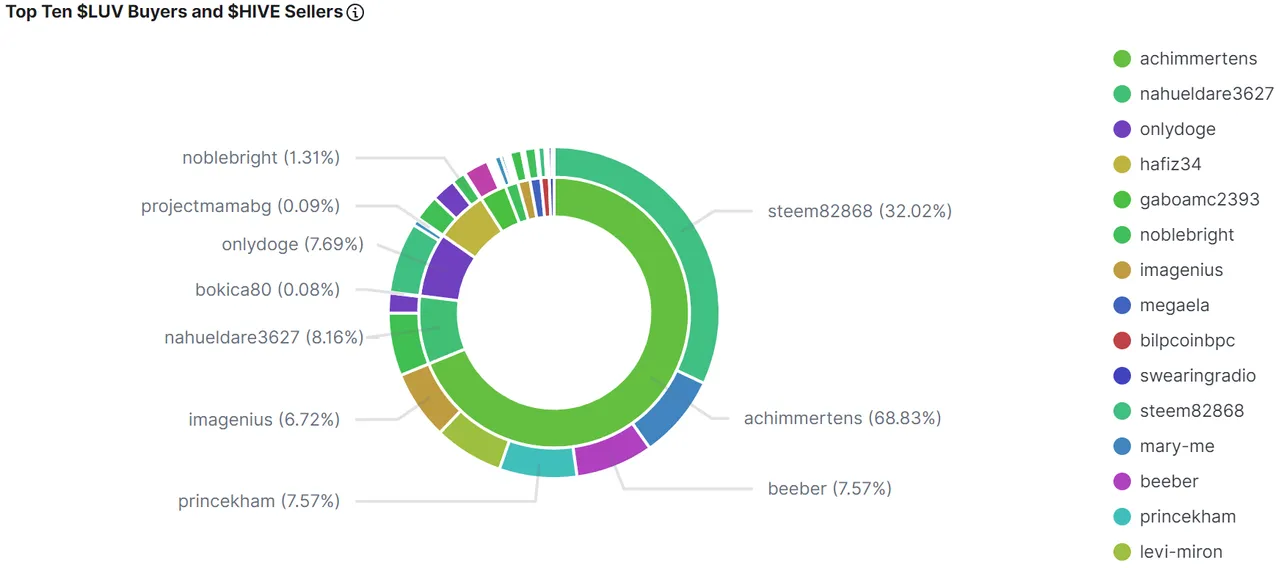
Top $LUV Buyers and $HIVE Sellers
The inside of the circle shows the buyers of $LUV, ordered by $HIVE they have spent. The outside shows the recipients of that $HIVE (sellers of $LUV):
Commulated Amount Of Bought $LUV Per Person
This figure shows the top 10 $LUV buyers, how much they got and how much $HIVE they spend for this. It is sorted by $HIVE, that was spent:
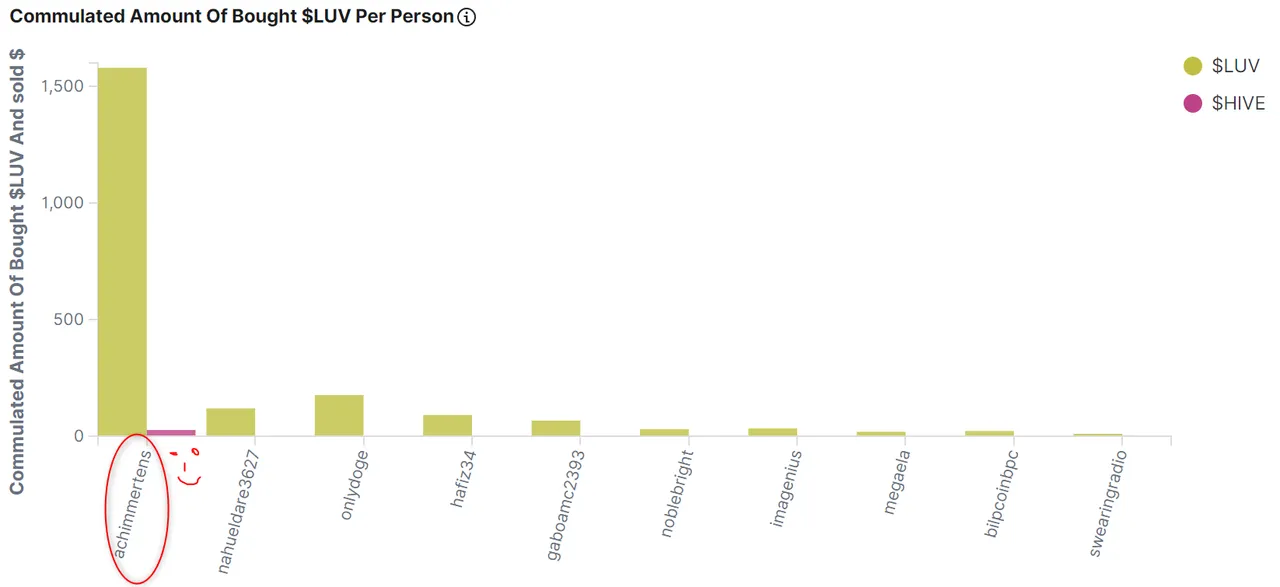
Table Of Top 20 $LUV Buyers
This table shows the top ten buyers of $LUV sorted by the $HIVE, they have spent:
| buyer.keyword: Descending | Sold $HIVE | Bought $LUV | Avg. Price |
|---|---|---|---|
| @achimmertens | 26.84797525417953 | 1579.2926760110659 | 0.017000000923871994 |
| @nahueldare3627 | 3.182466797530651 | 119.03635632991791 | 0.02671224996447563 |
| @onlydoge | 2.9999997839331627 | 176.36683654785156 | 0.017009999603033066 |
| @hafiz34 | 2.4459399531943893 | 90.80222953682159 | 0.026928571185895374 |
| @gaboamc2393 | 1.2395000159740448 | 67 | 0.01850000023841858 |
| @noblebright | 0.6040003970265388 | 30 | 0.01903078418511611 |
| @imagenius | 0.5662914402782917 | 33.116458892822266 | 0.017100000753998756 |
| @megaela | 0.5109100043773651 | 19 | 0.026890000328421593 |
| @bilpcoinbpc | 0.389240471762605 | 22.269371001049876 | 0.017908000200986863 |
| @swearingradio | 0.22199999541044235 | 10.038171291351318 | 0.02349499985575676 |
| @buezor | 0.16429126262664795 | 6.091630458831787 | 0.026969999074935913 |
| @edgerik | 0.1344499010592699 | 5 | 0.026889950037002563 |
| @metzli | 0.03420000150799751 | 2 | 0.017100000753998756 |
Commulated Amount Of Sold $LUV Per Person
This figure shows the top 10 $LUV Sellers, how much they sold and how much $HIVE they got for this, sorted by $HIVE:
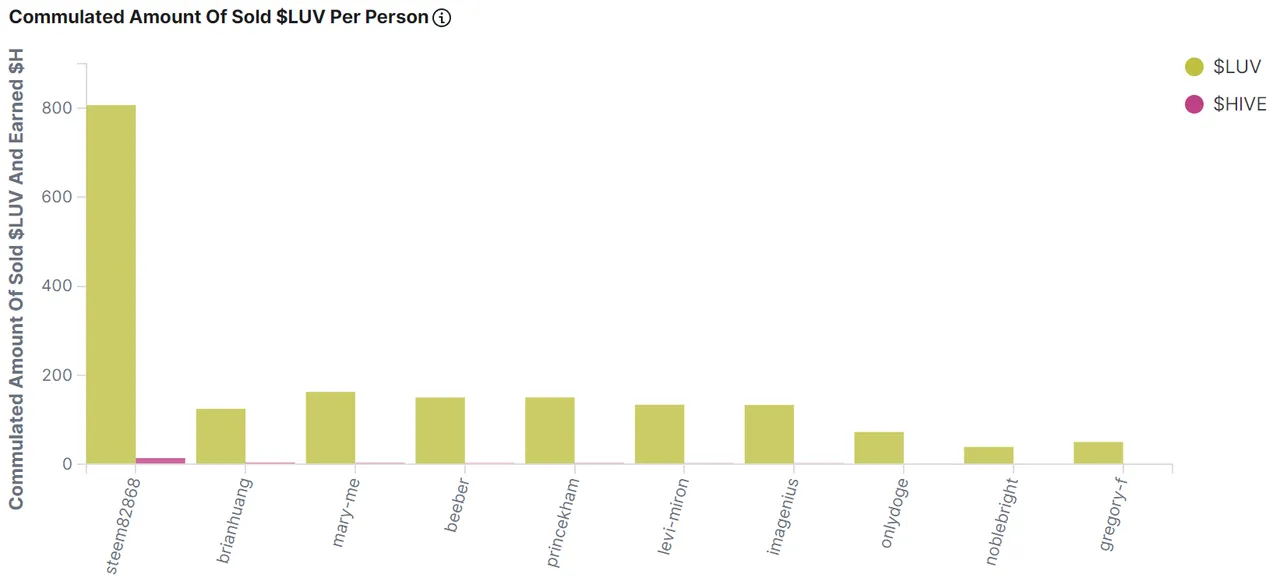
Table Of Top 20 $LUV Sellers
This table shows the top ten sellers of $LUV Sorted by the $HIVE, they have got:
| seller.keyword: Descending | Earned $HIVE | Sold $LUV | Avg. Price |
|---|---|---|---|
| @steem82868 | 13.72088062018156 | 807.0000038146973 | 0.017004286338176047 |
| @brianhuang | 3.3607486486434937 | 124.56663131713867 | 0.02697974955663085 |
| @mary-me | 2.762075185775757 | 162.47500610351562 | 0.017000000923871994 |
| @beeber | 2.549999952316284 | 150 | 0.017000000923871994 |
| @princekham | 2.549999952316284 | 150 | 0.017000000923871994 |
| @levi-miron | 2.2721009254455566 | 133.6529998779297 | 0.017000000923871994 |
| @imagenius | 2.263789415359497 | 133.16409301757812 | 0.017000000923871994 |
| @onlydoge | 1.9240487292408943 | 72.40172290802002 | 0.026777999475598335 |
| @noblebright | 1.0469999834895134 | 39 | 0.02685999994476636 |
| @gregory-f | 0.925000011920929 | 50 | 0.01850000023841858 |
| @gestion.alive | 0.6387301161885262 | 37 | 0.017402505036443472 |
| @borjan | 0.6119999885559082 | 36 | 0.017000000923871994 |
| @johndieo | 0.444599986076355 | 26 | 0.017100000753998756 |
| @demotry | 0.2720003128051758 | 16.000019073486328 | 0.017000000923871994 |
| @jerrytsuseer | 0.2549999952316284 | 15 | 0.017000000923871994 |
| @danielhuhservice | 0.23800000548362732 | 14 | 0.017000000923871994 |
| @rafasete | 0.22100000083446503 | 13 | 0.017000000923871994 |
| @dksart | 0.1876000016927719 | 7 | 0.026799999177455902 |
| @criptosectadepit | 0.1870415210723877 | 11.002442359924316 | 0.017000000923871994 |
| @mann0000 | 0.18700000643730164 | 11 | 0.017000000923871994 |
| @other | 2.72264991979302 | 151.7508115974221 | 0.017950582881133225 |
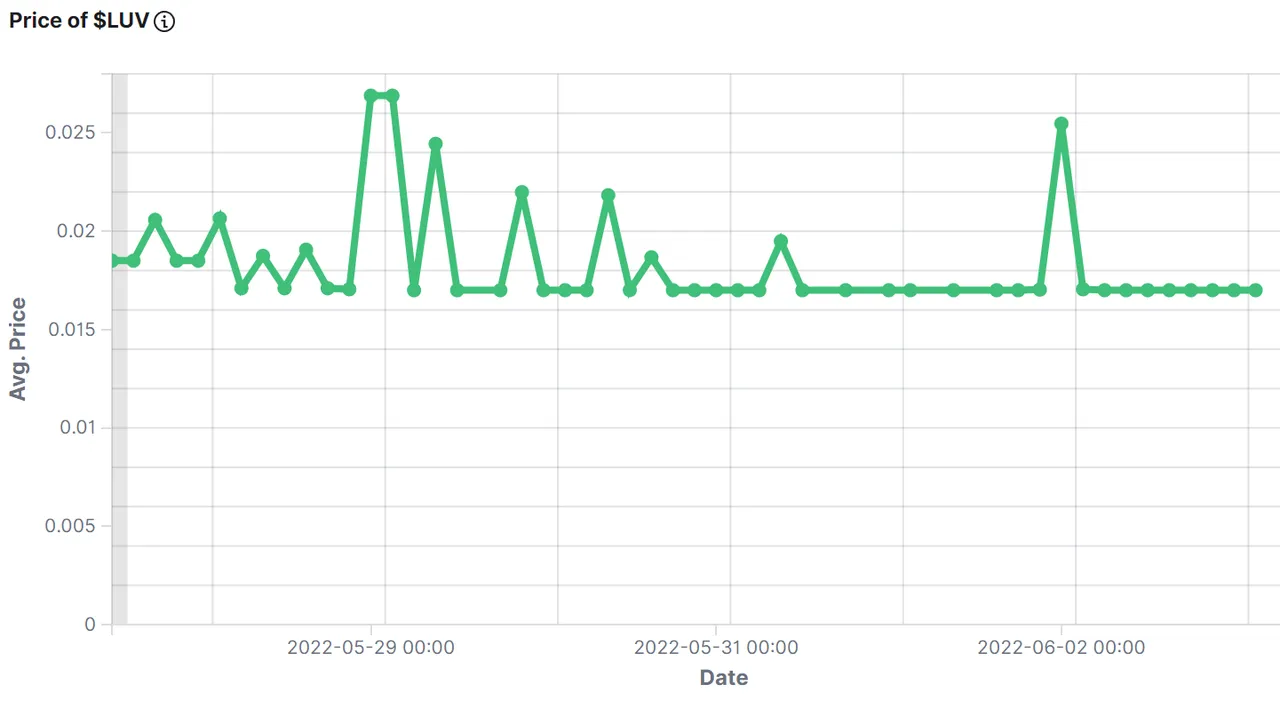
Price of the $LUV
This figure shows the price of $LUV for the last period:
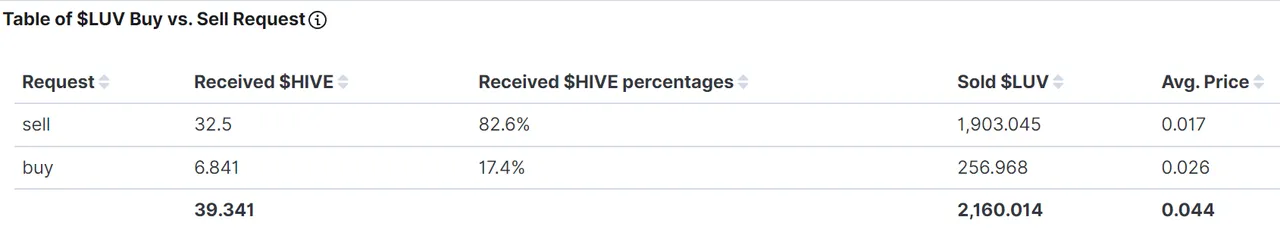
$LUV Summarize Metrics
This table shows how much $HIVE was given by buy-requests, that where equal or higher than the sell order vs. sell-requests, that were equal or lower than the buy order.
If the buy-requests where higher than the sell-requests, then money comes into the system and the value of the token increases.
Under the total line one can see the sum of $HIVE and sum of $LUV that changed the ownership and the average price of $LUV for the last period.
The average price of the token in the picture is wrong, actually it was: 0.019 $HIVE/$LUV
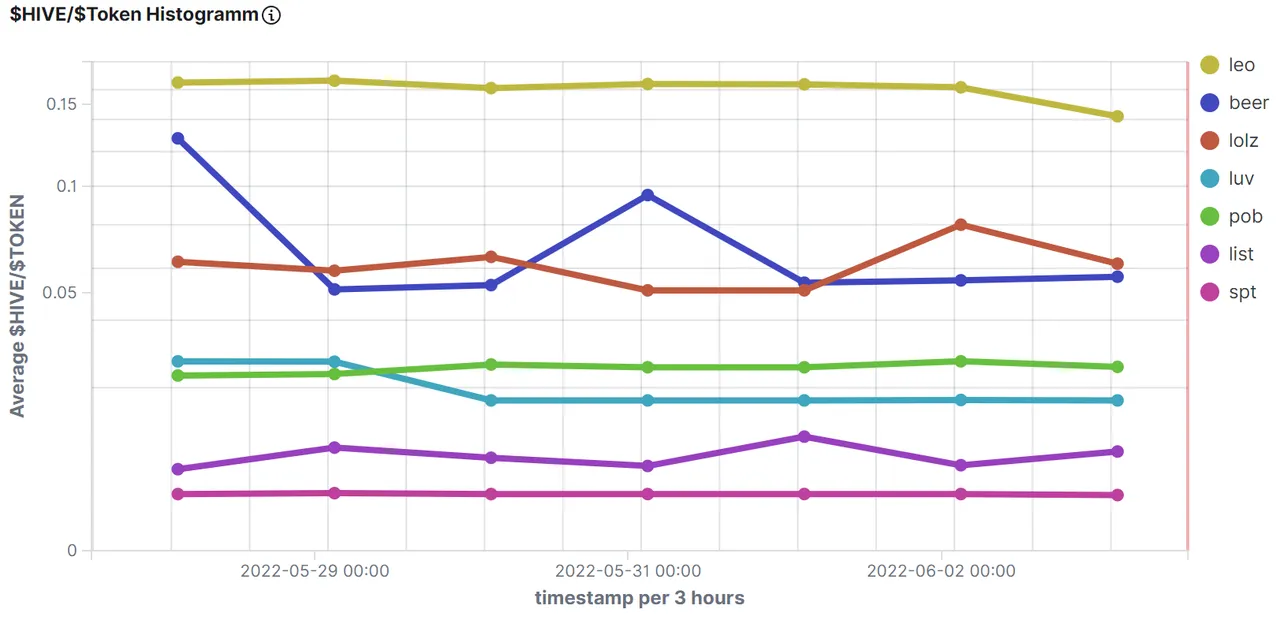
Comparison With Other Tokens
$HIVE/Token
This figure shows the value of $HIVE compared to some token for the last period. Be aware of the nonlinear (root square) y-axes.
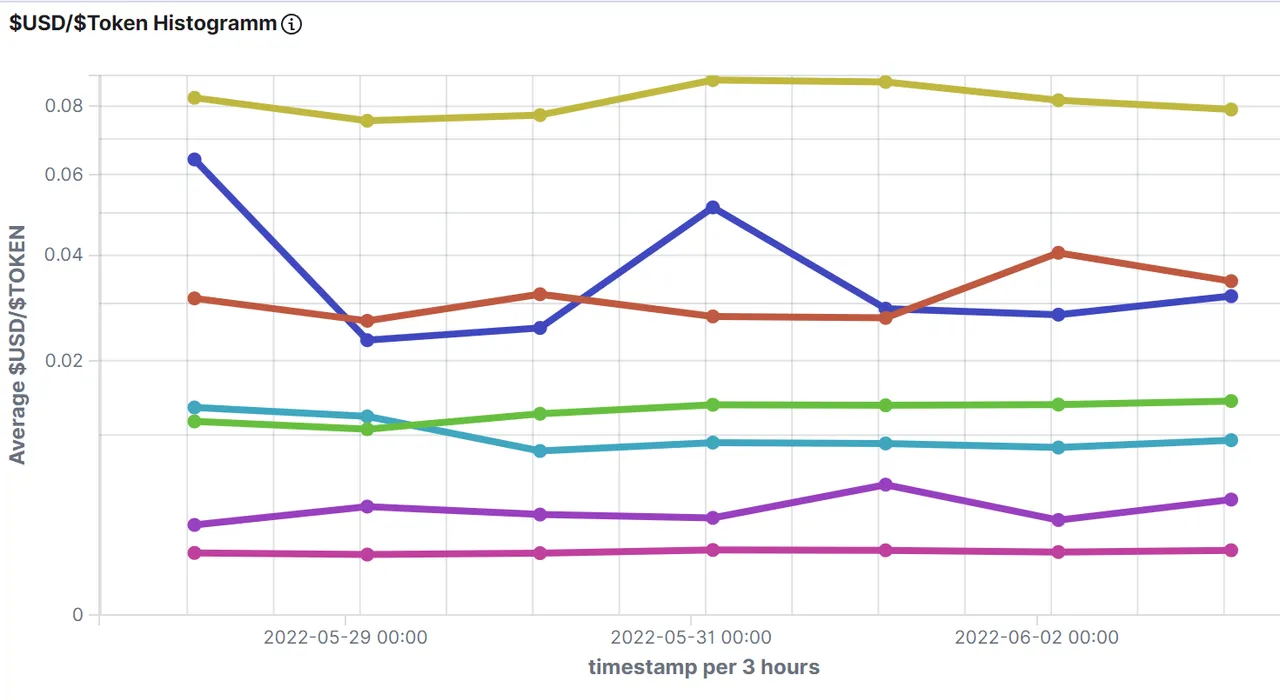
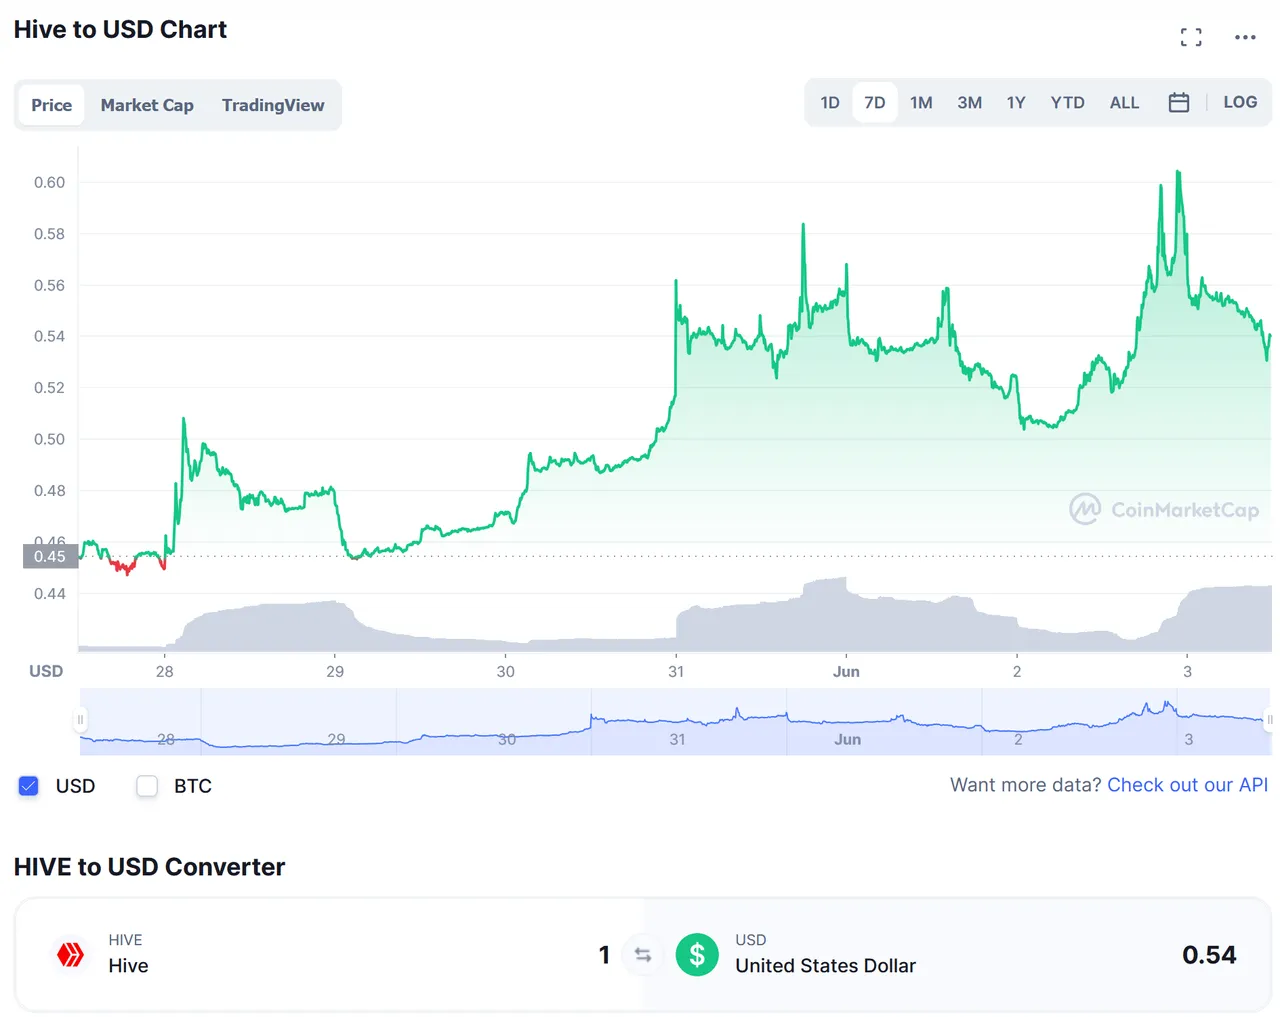
US-Dollar/Token
This figure shows the value of $USD compared to some token for the last period. Be aware of the nonlinear (root square) y-axes.
origin
Rank: 131
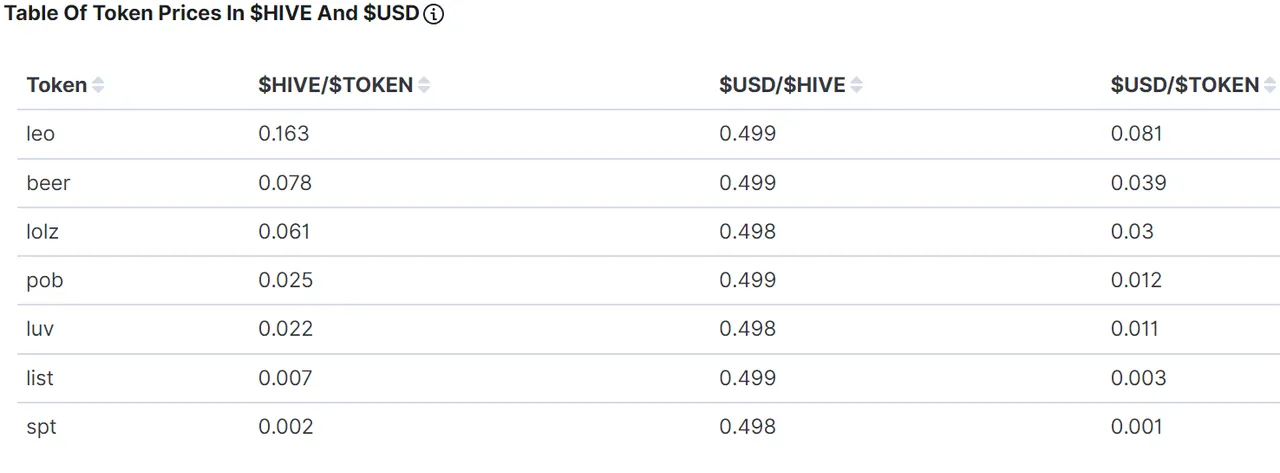
Table Of Token Prices in $HIVE and $USD
This table shows the average value of the prices of the token for the last period. One can see Hive and the US-Dollar compared to the token.
Disclaimer
All stats are without warranty.
They are taken from:
curl -XPOST -H "Content-type: application/json" -d '{ "jsonrpc": "2.0", "method": "find", "params": { "contract": "market", "table": "tradesHistory", "query": { "symbol": "LUV"}, "limit":1000, "offset": 0 }, "id": 1 }' 'https://api.hive-engine.com/rpc/contracts'
I have put them into logfiles and uploaded them to Kibana, from which I took the screenshots.
If you find errors, please tell me!
If you want me to continue the stats, give me some good upvotes ;-)
If you want to see other statistics (even from totaly other data), please contact me. I can create them weekly or monthly if I get some rewards for it.
For more details see here: How I Have Set Up Elasticsearch And Kibana On My Raspberry Pi To Monitor Token Activities and here: Do You Want To See Statistics Of Your Favorite HIVE Token? or on github.
Here are the stats from the other tokens I observe: @achimmertens/posts?filter=stats
Regards, Achim Mertens