
For the longest time I've been wondering about getting historical graphs of SBD supply. Obviously this is an important thing to track if you are an active trader, but for me it's just to keep tabs on its progress.
I've recently been scraping data from steem nodes to fetch the SBD supply, basically the info you would get from steemd and recording its value every day. (I am wondering if anyone else has been doing this, so we can get accurate numbers for this).
But recently I searched around and found this post which has a method for grabbing historical data that you can roughly derive the supply from. It's a bit up and down though, and I've filled it in with my own data over the past few months.
So I put what I have so far in a public spreadsheet that you are free to copy and play with. The link is here. My data is in column L that I've been scraping, and I'll see if I can fish other posts that have been tracking this in the past also. You can also play with filters to restrict the date range and the chart will reflect that as well.
One of the fun things you can do with it is fetch historical price data using the CryptoFinance google Sheets add-on. This was a very useful service I used to help with tax reporting as well (another story).
Anyway, let's get to some interesting graphs.
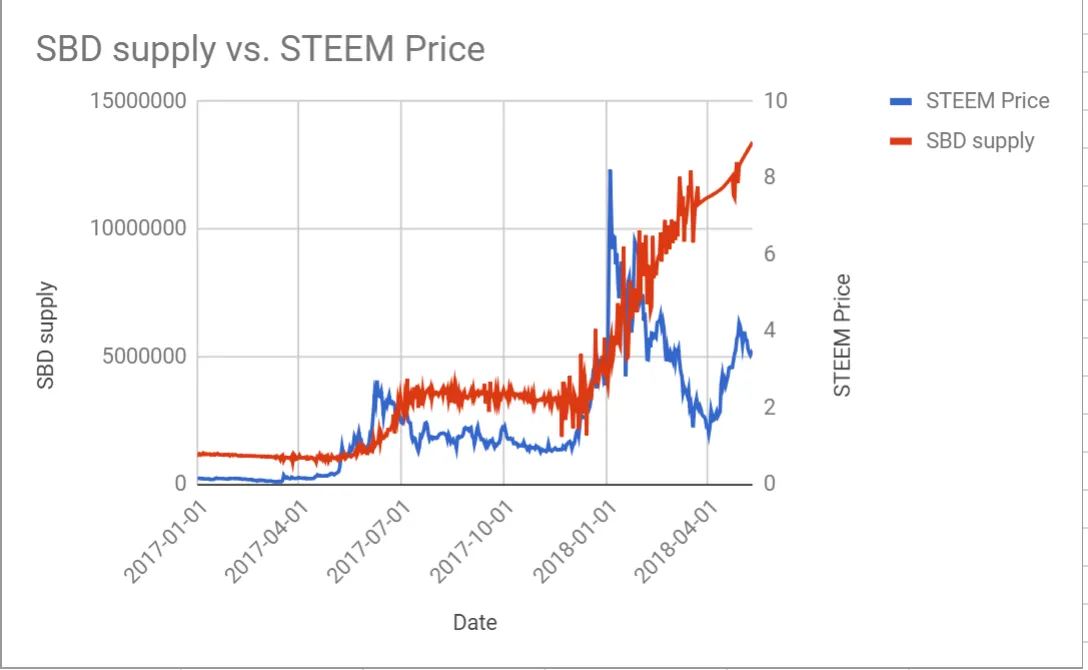
This starts from January of 2017, and plots SBD supply (left axis) with the STEEM price (right axis). You'll notice a smoothing of the SBD supply towards the end, where I have the more accurate data, and a slight blip (since in my polling I lost a couple days of data). I basically want to highlight here that the STEEM price is driving the changes in SBD supply. If you've been following my posts about SBD and payouts, this should come as no surprise to you. Basically, when STEEM price is high, you'll note that the rate that SBD is printed also becomes higher.
This is entirely as it should be, because as far as the platform is concerned, the value of your post is essentially in STEEM, and it pays half of it as STEEM, and half of it in what it thinks is the conversion equivalent of SBD, never mind what the market values SBD as. And this creates a natural mechanism for the desired peg to be satisfied. If STEEM price is well supported, the platform prints more SBD in reaction, and that naturally will drive prices down in the long run. And then the platform has mechanisms to support the price of SBD to peg it at 1 USD (mainly the conversion mechanism, which nobody sees anymore but is still there).
The moral of this story?
- The better STEEM does, the more you should be worried about the value of your SBD.
But, in the interim, the supply is still tiny and easily manipulated with respect to other cryptocurrencies, so we may yet still see some fun spikes to throw off the long term analysis. And can someone please tell me if the money that's on the exchanges is aware of this or not? Because I have a hard time believing that they are aware of this.