
This is a weekly overview post of the Analysis category at @utopian-io. The report aims to provide insight into the topics covered, the scores provided, staff picks (if any), and a look at how the current week has fared against recent weeks gone by.
Any other work taking place and my personal thoughts in relation to the category will also be included in the final section.
If you have any suggestions for additional information that could be included in this report, please comment below.
This report covers 2 weeks due to there being only one contribution in week 48.

Previous reports
Weekly overview: 43, 44, 45-46, 47
Analysis contributions summary
Week 48: October 22nd - 28th November (inclusive)
- No staff picks this week
- 1 Contribution with a score of 93
- 21 comments (higher than the recent average)
Week 49: October 29th Nov - 5th December (inclusive)
- 2 staff picks this week
- 6 contributions, 6 scored, 5 unique contributors
- An average score for the week of 75.7
- An average of almost 23 comments per contribution - higher again than recent averages
Contributions
Week 48
| Contributor | URL | Score | Comments |
|---|---|---|---|
| crokkon | How much of the total Steem SP is not voting? | 93 | 21 |
Week 49
| Contributor | URL | Score | Comments |
|---|---|---|---|
| abh12345 | Where is the engagement - apps | 88 | 51 |
| miniature-tiger | Steem earnings distribution | 96 | 32 |
| holger80 | Full node report - November | 92 | 12 |
| paulag | New Steem account report - November | 71 | 26 |
| miniature-tiger | utopian-io vote analysis - November | 77 | 8 |
| lostmine27 | Structural change analysis - KR | 30 | 8 |
In week 48, 'crokkon' produced an analysis which took a look at how much Steem Power is voting for content. Excluding the SP held by known Steemit accounts, the following was noted:
72% of the remaining vested Steem has voted within the last 3 days, 74% has voted within the last two weeks
10% of the vested Steem hasn't voted within the last year and 5% hasn't voted ever
In week 49, 'miniature-tiger' (who produced 2 analysis contributions during this week), took a look at the distribution of Steem earnings with a view to finding out how much users typically earn through posting and commenting, and if there is an an even distribution of rewards.
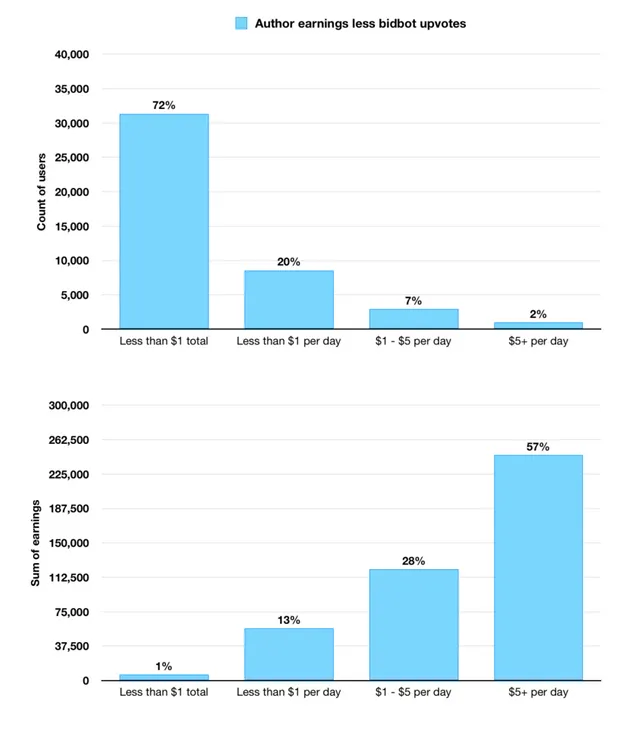
source
The analysis discovered that:
2% of accounts (970 users) earn 57% of author rewards
9% of accounts (3907 users) earn 85% or author rewards
72% of accounts took home 1.5% of author rewards between them
Clearly the distribution of earnings is heavily stacked towards a small percentage of the total Steem accounts.
Also in week 49, a new analysis from 'holger80' which focused on Steem full node activity. This monthly report contained a vast number of charts allowing the witnesses running full nodes to compare their servers to other nodes. A technical report, valuable for the witnesses and those seeking the quickest full- nodes to develop against.
In summary, I'm really happy to see 6 contributions in week 49 - the best total in a while. 5 of the 6 gained very respectable scores, and only one fell short and took a manual vote because of the limited scope of the analysis.
Analysis and visual reporting
The aim of this section is to represent the current weeks activity along with a recent set of data. The current data span covers the previous 8 weeks.
Weekly Average Score and number of Contributions
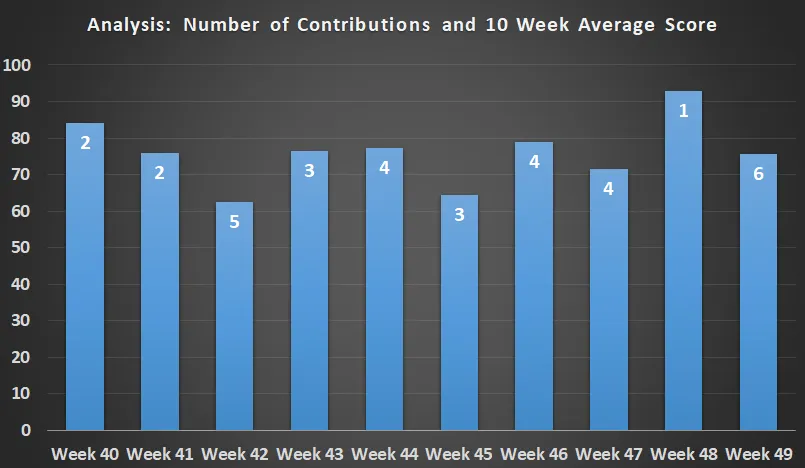
An average score of 75.7 this week (49) almost equal to the 10 week average. Six contributions is 2 more than any week in the previous 9 and 2.6 higher than the average weekly total.
Contributor Totals and Average Score
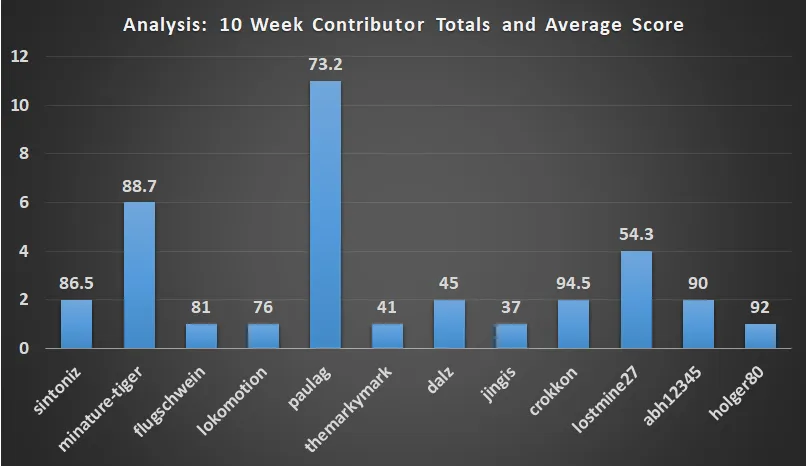
Six contributors have an average contribution score higher than 80 in the past 10 weeks and the category continues to produce a good standard of contribution.
Contributions that did not receive a score are not included in the charts above.
Review Totals by Reviewer (Scored / Not scored)
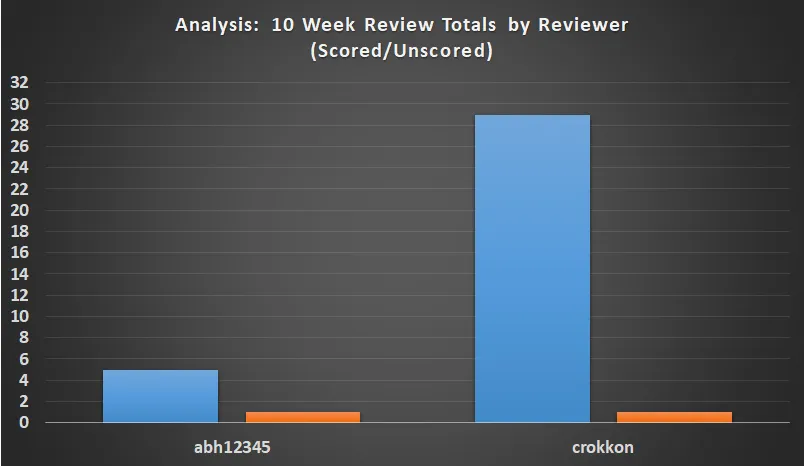
Two reviewers assessed all 34 contributions that received a score in the past 10 weeks. Both reviewers were unable to give a score to 1 contribution each.
Other items
In a previous weekly report, I discussed possible methods that could be used to try and encourage growth in the analysis category. After discussions in the weekly team meeting, it was decided that approaching previous contributors would be a suitable option. Doing this may boost the number of submissions but perhaps more importantly, provide information as to why previous contributors are no longer submitting to the category.
Following this past week, we now have a total of 41 unique contributors to the Analysis category in 2018. 12 of these contributors have submitted work to @utopian-io in the past two months, and so it could be said that almost 75% of the unique contributors to @utopian-io this year are currently inactive.
During this week, I will try to contact a handful of these inactive contributors via Discord, with a message similar to the following:
Hi X, I'm writing to you because during his past year, you have contributed to the Analysis category at @utopian-io. We'd very much like to see you contributing again due to the high quality of your work, but understand it is your choice. If you have no plans to contribute at present, would it be possible to give a brief reason as to why? e.g. guidelines to strict / nothing new/exciting to analyse / price of STEEM. Thanks very much for your time, Asher [Community Manager - Analysis]
I will report back on this next week.
Thank you for your time today.
Asher