
Repository
https://github.com/steemit/steem
Aim of Analysis
Every month I produce a Post bench-marking report with the aims of:
• Aiding the STEEM Community with a place to benchmark their posts and growth
• Create a report that can be used for comparisons in other periods
• To track my personal targets and record achievements
Please note this data is based on Posts and not Comments.
Last month I prepare a dual report for both July and August however after receiving feedback, I am now reverting back to monthly posts.
You can read that report here:
/@paulag/july-and-august-18-steemit-post-bench-marking-report-blockchain-business-intelligence
Looking at September we had HF20, which caused a major disruption in activity on the block for the last week of the month. Votes, Comments and Posts were all down. This needs to be taken into consideration when comparing with previous months.
Financial Performance
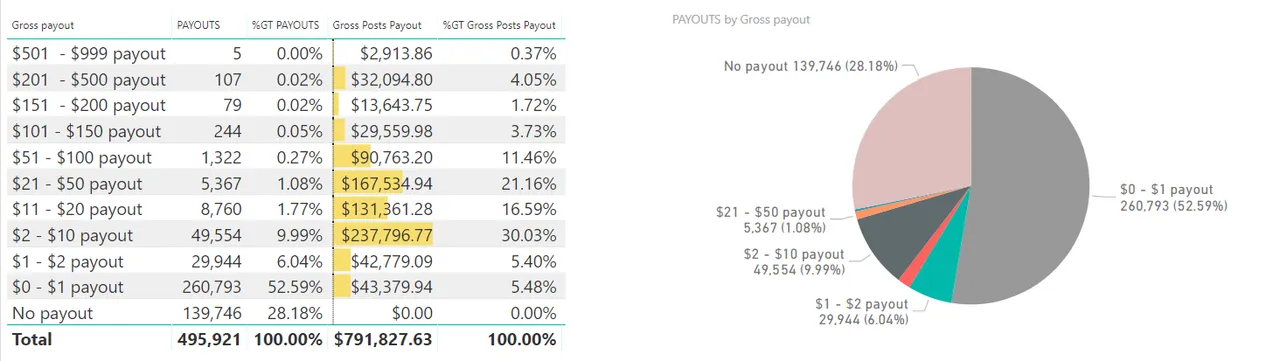
In September 18 the % of posts with no payout was just over 28%, slightly down on last month.
The % of posts with a payout of <$1 has remained consistent on last month at 52%
The number of posts with a payout of over $500 is down from 19 last month to only 5 in September.
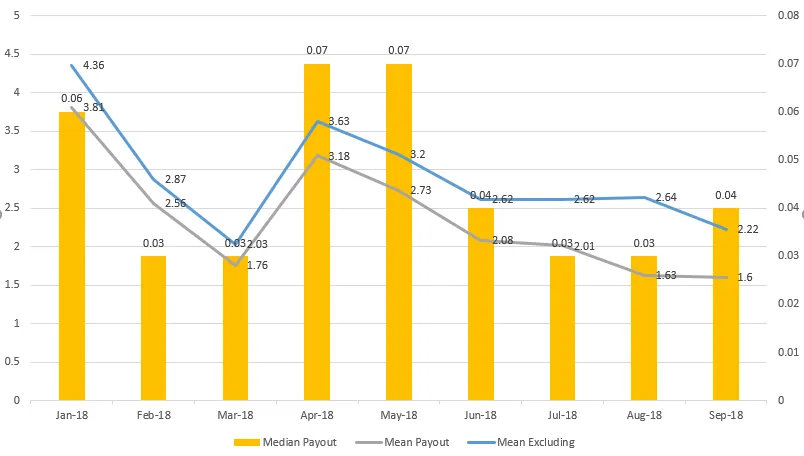
The average post pay-out value in September was $1.63 and if we exclude posts with no payout this increases to $2.22
The median payout value was $0.04 with a standard deviation of 8.07.
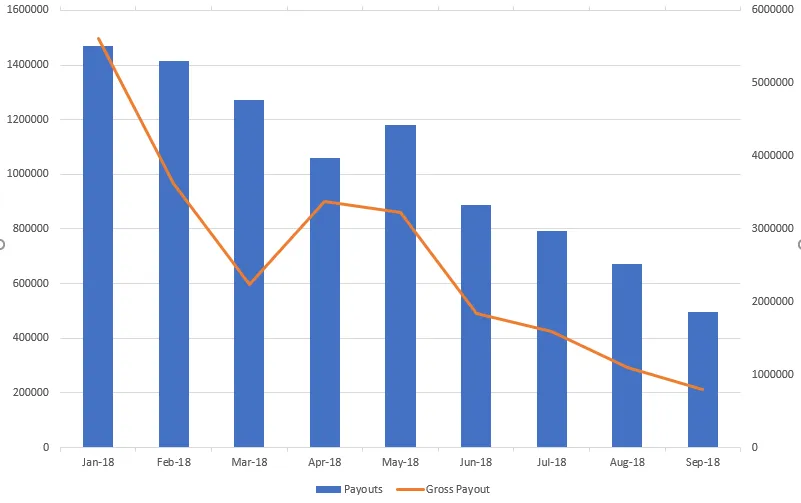
The number of posts decreased by 26% on the previous month and the gross payouts by 27%
You can see how this compares to previous period in the charts below.
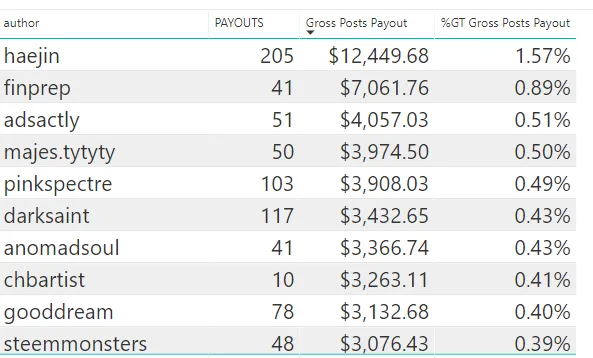
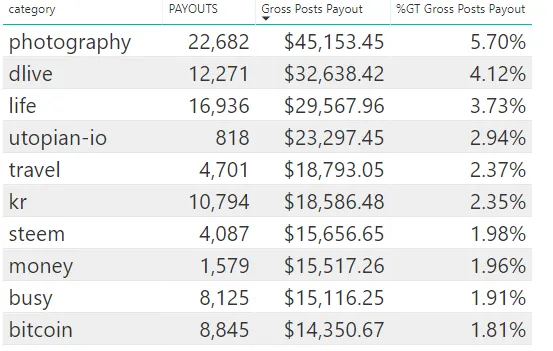
Top Authors based on Gross post payouts
Top Category
Comments
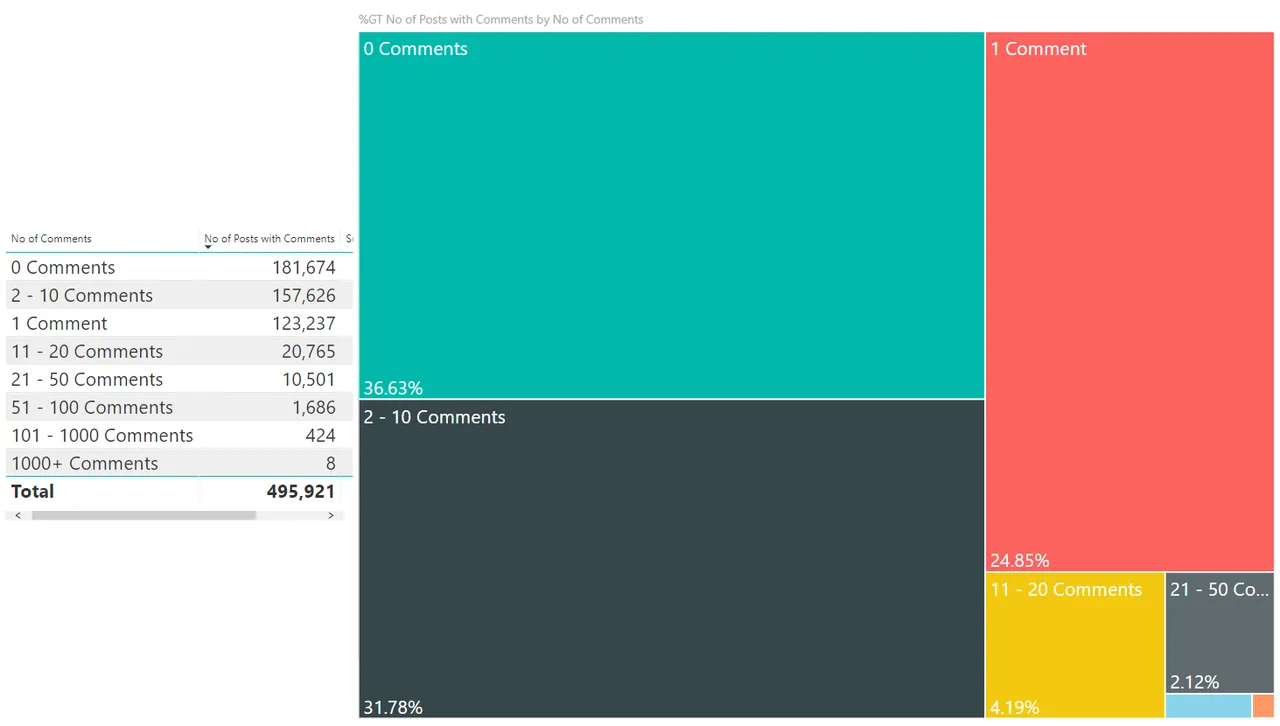
The % of posts with no comments is down from 38.43% in Aug to 36.6% in September.
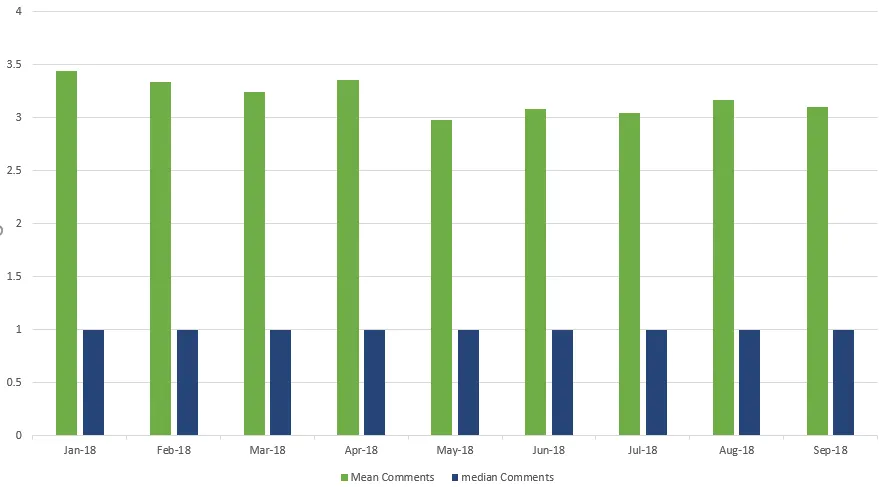
The mean number of comments per post is 3.1, and the median is 1. You can see how this compares to previous period in the chart below.
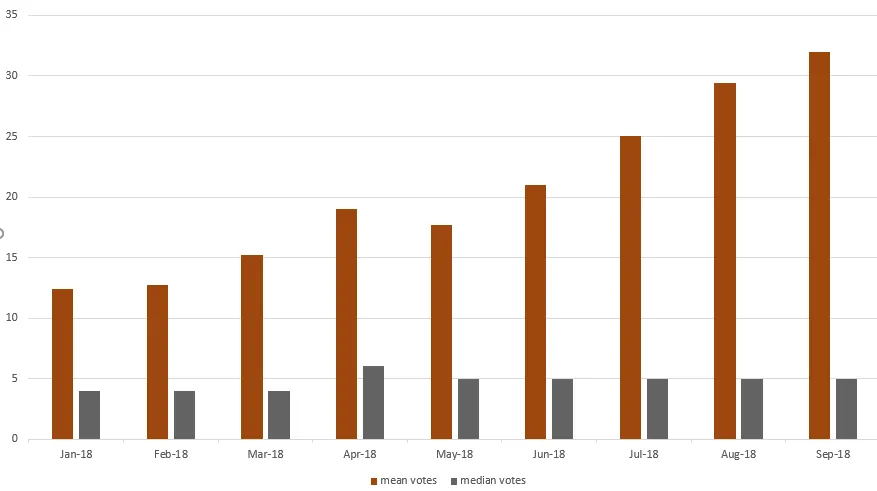
Votes
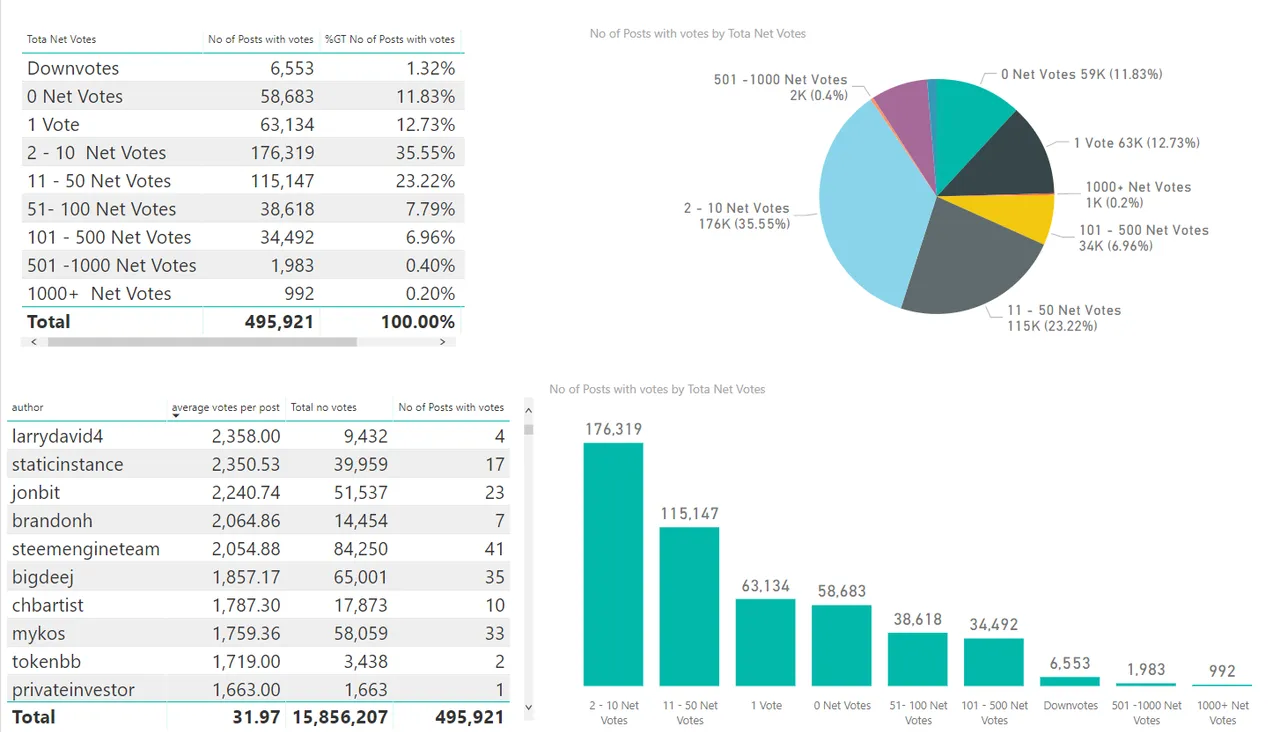
The % of posts with 0 net votes has increased remained consistent with last month.
The median votes per post was 5 and the average was 31.97. You can see how this compares to previous period below.
Flags
In votes above we also have flags, however combined only 1.32% of posts had a net downvote. This is up from 1.27% the previous month.
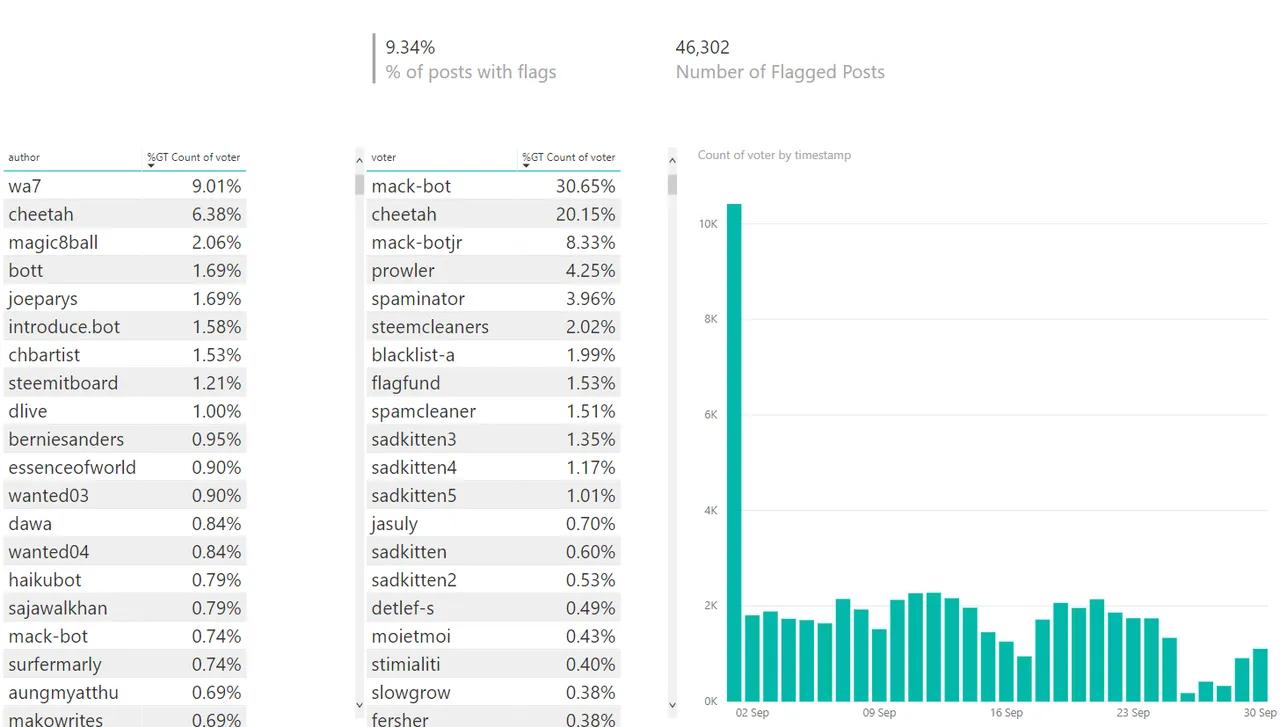
46K posts received 1 or more flags (this is posts not comments). This makes up 9.34% of all posts made. This is down from 10.82% the previous month.
In the first table we can see the authors with the highest % of flags and after this the table shows who gave the most flags. Following this we can see the time series for when flags were given
Other Data
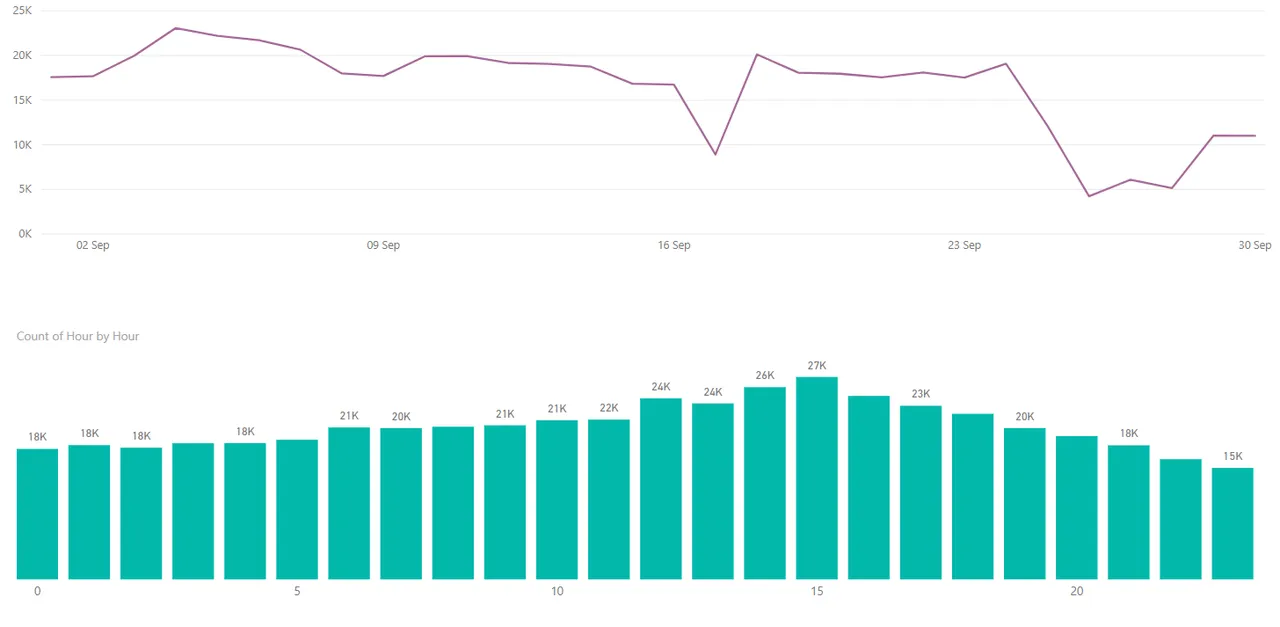
The line chart above represents the number of new posts per day in September 18 and the bar chart below that shows the peak posting hours.
Conclusion
The total number of month posts and the gross post payout has been declining all year however the median payout has varied between 3 and 7 cent. However the last week of September there were restriction with posting and voting due to the HF and it will be interesting to see how much the posts and gross payout increases for October,
The mean comments per post has remained rather consistent this year between 3 and 3.5 and September seen no change to this.
The mean number of votes per post has steady increased this year, however there has been little change in the median value.
The Data and Queries
As always I have connected to Steemsql managed by @arcange using Power BI and the query is used was
SELECT author, category, created, children, total_payout_value, net_votes, pending_payout_value FROM Comments (NOLOCK) where created >= CONVERT(DATE,'2018-09-01') and created< CONVERT(DATE,'2018-10-01') and depth = 0The code used to get flag details was
SELECT*FROM txVotes (NOLOCK)where timestamp >= CONVERT(DATE,'2018-09-01')and timestamp< CONVERT(DATE,'2018-10-01')and weight <0