
In a recent contribution I mentioned about the under-utilization of the Internal Currency Market considering the perk of not having to pay fees on trades. Recently however, I've noticed an increase in the volume of trades done. I wanted to first confirm that there's indeed been an increase in the transactions done in the Internal Market, and when confirmed try to understand what potentially drove the change.

I used the existing spreadsheet I worked on in analyzing the trend and participants of of the Internal Currency Market from this contribution; Steemit Business Intelligence: Internal Market Participants & Transaction Trends. I then re-run the query to get the daily level transactions using this:
SELECT
DATEADD(DAY, DATEDIFF(DAY, 0, timestamp), 0) AS [year_month_date_field], COUNT(amount_to_sell) COUNT
FROM
TxLimitOrders
GROUP BY timestamp
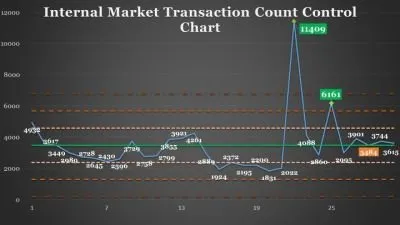
I used the filter function in excel to just show the data daily for November. I know I could have done this in the query too and would have saved me time, but I wanted to look at past months' daily level trend too in the future. When the table was generated, the transaction for the 22nd of November jumped out to be 11,400. The simple control chart below shows how 11,400 transactions was clearly outside the control chart. It is over 300% from the 30 days average daily transaction count near 3,480.
Steemit Internal Currency Market Transaction Count Control Chart
I remember telling my wife to convert her SBD to Steem some time last week when the SBD price hit over $2. I thought that this might very well have something to do with the increased utilization of the Internal Market. So looked at the price movement of Steem and SBD for the same period and plotted both against the count of transaction in the Internal Currency Market.
Steem Price & Internal Market Transaction Count Trend
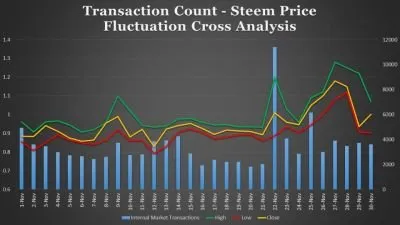
In this chart I plotted the low, high, and closing price of Steem using the Historical Data feature of coinmarketcap.com. Here it can be seen that more transactions are done in the Internal Market on days where the price fluctuates more than usual. While most evident on the 22nd of November, the same trend can be observed for the 9th, the 25th, and the 27th.
Here is the data shown in a table.
| Date | Internal Market Transactions | High | Low | Close |
|---|---|---|---|---|
| 1-Nov | 4932 | 0.96 | 0.85 | 0.88 |
| 2-Nov | 3617 | 0.91 | 0.81 | 0.88 |
| 3-Nov | 3449 | 0.96 | 0.85 | 0.94 |
| 4-Nov | 2989 | 0.97 | 0.89 | 0.91 |
| 5-Nov | 2728 | 0.94 | 0.86 | 0.87 |
| 6-Nov | 2645 | 0.91 | 0.85 | 0.86 |
| 7-Nov | 2430 | 0.92 | 0.84 | 0.86 |
| 8-Nov | 2596 | 0.96 | 0.86 | 0.95 |
| 9-Nov | 3729 | 1.10 | 0.92 | 0.99 |
| 10-Nov | 2758 | 1.02 | 0.86 | 0.88 |
| 11-Nov | 2799 | 0.94 | 0.86 | 0.92 |
| 12-Nov | 3855 | 0.93 | 0.79 | 0.83 |
| 13-Nov | 3921 | 0.94 | 0.83 | 0.92 |
| 14-Nov | 4261 | 0.98 | 0.91 | 0.94 |
| 15-Nov | 2889 | 0.98 | 0.92 | 0.95 |
| 16-Nov | 1924 | 0.96 | 0.90 | 0.93 |
| 17-Nov | 2372 | 0.94 | 0.87 | 0.89 |
| 18-Nov | 2195 | 0.95 | 0.88 | 0.92 |
| 19-Nov | 2200 | 0.93 | 0.89 | 0.91 |
| 20-Nov | 1831 | 0.93 | 0.89 | 0.91 |
| 21-Nov | 2022 | 0.93 | 0.86 | 0.89 |
| 22-Nov | 11409 | 1.20 | 0.89 | 1.01 |
| 23-Nov | 4088 | 1.03 | 0.94 | 0.96 |
| 24-Nov | 2860 | 0.96 | 0.90 | 0.95 |
| 25-Nov | 6161 | 1.09 | 0.94 | 1.05 |
| 26-Nov | 2995 | 1.12 | 1.00 | 1.10 |
| 27-Nov | 3901 | 1.28 | 1.08 | 1.18 |
| 28-Nov | 3484 | 1.25 | 1.12 | 1.15 |
| 29-Nov | 3744 | 1.22 | 0.91 | 0.94 |
| 30-Nov | 3615 | 1.07 | 0.90 | 1.00 |
SBD Price & Internal Market Transaction Count Trend
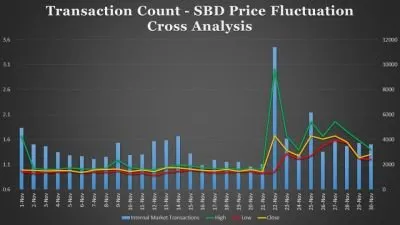
The same observation on the correlation of Internal Market transaction count and price swings only becomes more clear in this chart. Observe that on a typical day, there's barely any swings intra-day in the price of SBD. On the days however that the swings in price are evident like on the 1st, 9th, 22nd, 25th, and 27th the count of transactions in the Internal Market are also higher than the average.
Here is the data shown in a table.
| Date | Internal Market Transactions | High | Low | Close |
|---|---|---|---|---|
| 1-Nov | 4932 | 1.67 | 0.96 | 0.99 |
| 2-Nov | 3617 | 1.02 | 0.92 | 0.98 |
| 3-Nov | 3449 | 1.00 | 0.94 | 0.97 |
| 4-Nov | 2989 | 1.00 | 0.95 | 0.98 |
| 5-Nov | 2728 | 1.03 | 0.96 | 0.98 |
| 6-Nov | 2645 | 1.01 | 0.94 | 0.94 |
| 7-Nov | 2430 | 1.01 | 0.95 | 0.99 |
| 8-Nov | 2596 | 1.02 | 0.95 | 1.00 |
| 9-Nov | 3729 | 1.19 | 0.97 | 1.01 |
| 10-Nov | 2758 | 1.04 | 0.91 | 0.96 |
| 11-Nov | 2799 | 1.00 | 0.93 | 0.99 |
| 12-Nov | 3855 | 0.99 | 0.88 | 0.96 |
| 13-Nov | 3921 | 1.04 | 0.94 | 1.03 |
| 14-Nov | 4261 | 1.08 | 0.96 | 1.03 |
| 15-Nov | 2889 | 1.07 | 0.99 | 1.01 |
| 16-Nov | 1924 | 1.03 | 0.97 | 0.98 |
| 17-Nov | 2372 | 1.02 | 0.94 | 0.97 |
| 18-Nov | 2195 | 1.02 | 0.95 | 1.00 |
| 19-Nov | 2200 | 1.01 | 0.96 | 0.96 |
| 20-Nov | 1831 | 1.01 | 0.96 | 0.99 |
| 21-Nov | 2022 | 1.01 | 0.93 | 0.96 |
| 22-Nov | 11409 | 3.02 | 0.95 | 1.68 |
| 23-Nov | 4088 | 1.67 | 1.32 | 1.38 |
| 24-Nov | 2860 | 1.38 | 1.21 | 1.27 |
| 25-Nov | 6161 | 1.96 | 1.27 | 1.67 |
| 26-Nov | 2995 | 1.66 | 1.47 | 1.61 |
| 27-Nov | 3901 | 1.96 | 1.59 | 1.67 |
| 28-Nov | 3484 | 1.76 | 1.53 | 1.55 |
| 29-Nov | 3744 | 1.58 | 1.22 | 1.23 |
| 30-Nov | 3615 | 1.40 | 1.20 | 1.30 |
While the Internal Currency Market operates separately from the exchanges, a lot of decision making on when to trade, and what price points to use for buying and selling Steem are still driven by the actual market price of Steem and SBD.
Posted on Utopian.io - Rewarding Open Source Contributors