
Details
The analyst has done a couple of analysis about the Internal Currency Market. In both contributions however, the analyst used the TxLimitOrders table of the Steem SQL database. The TxLimitOrders table is great in capturing the count of the transactions and participants, the volume and conversion rates between the two Steem blockchain currencies however, are not available in that table. For transparency, here are the two other analysis about the internal market done five and four months ago respectively.
- Internal Market Participants & Transaction Trends
- Internal Market Trend In Relation to SBD/Steem Price Swings
There are different opinions about whether it is better to use the internal market, or external exchanges in converting between Steem and Steem Dollars. The analysts wanted to put data-points together to aide in the decision making process for trading between the two Steem blockchain currencies. The analyst have seen comments against the use of the Internal Currency Market saying that using external exchanges would more often give a better rate. One of the main objectives of this contribution is to find out whether there is some merit to such claims.
Outline
The analyst will show data-points outlined here to support or disprove claims that it is better to use external exchanges to convert between the Steem blockchain currencies, the behavior pattern in selling/buying relative to the conversion rate, and the top users providing liquidity to the internal market.
- External Exchanges & Internal Market Conversion Rate Comparison
- Steem & Steem Dollar Sell Order Count Relative to Prices and Conversion Rate
- Top Internal Market Participants by Volume
Scope of Analysis
The analysts will compare the exchange rate when trades are done using external exchanges against when trade are executed in the Internal Currency Market. The data captured are from the 18th of July 2016 which is the first available data for Steem Dollar trades in CoinMarketCap. The first trades in the Internal Currency Market was on the 4th of July 2016, but to make the analysis as accurate as possible, the data was delimited to the dates when all data required are available.
In charts showing monthly trends, the analyst removed the data for July, 2016. The volume and count of transaction on the first month of implementation was anomalously high. paulag's contribution Steemit Historic Data – Removing Liquidity Rewards five month ago might help explain the unusually high volume of transactions. The analyst deemed that the transaction count and volume post the sunset of the Liquidity Rewards feature were normalized.
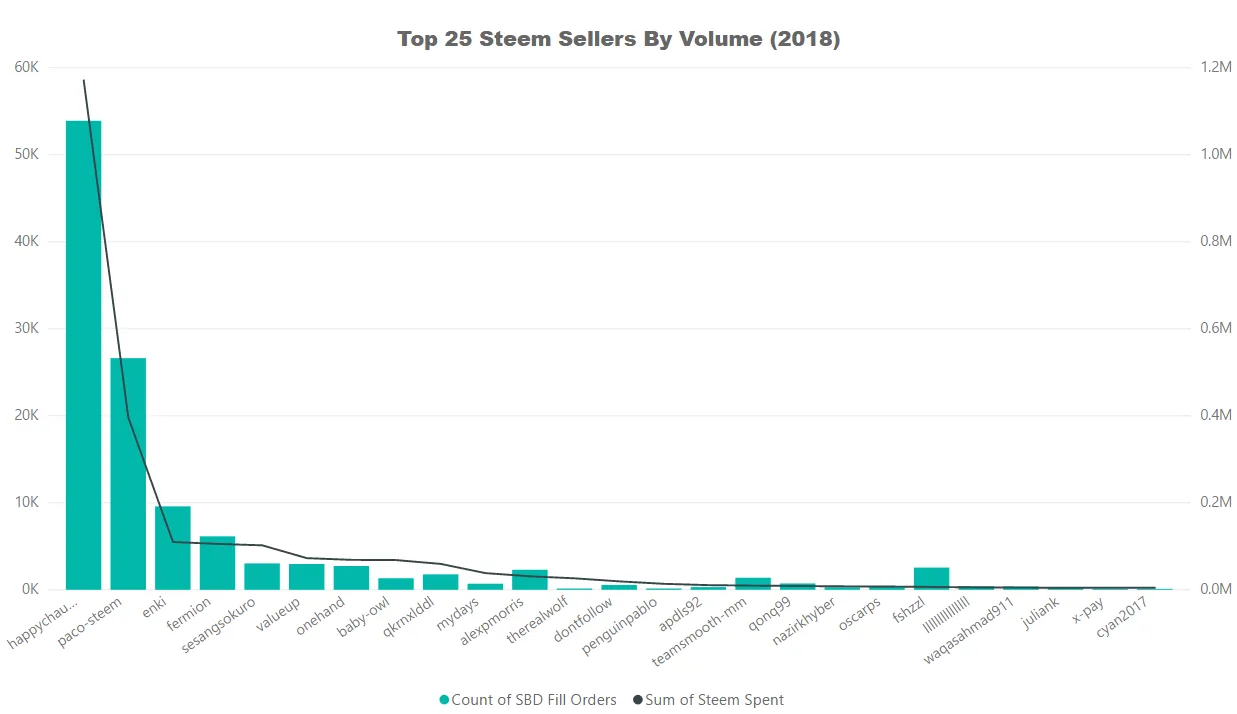
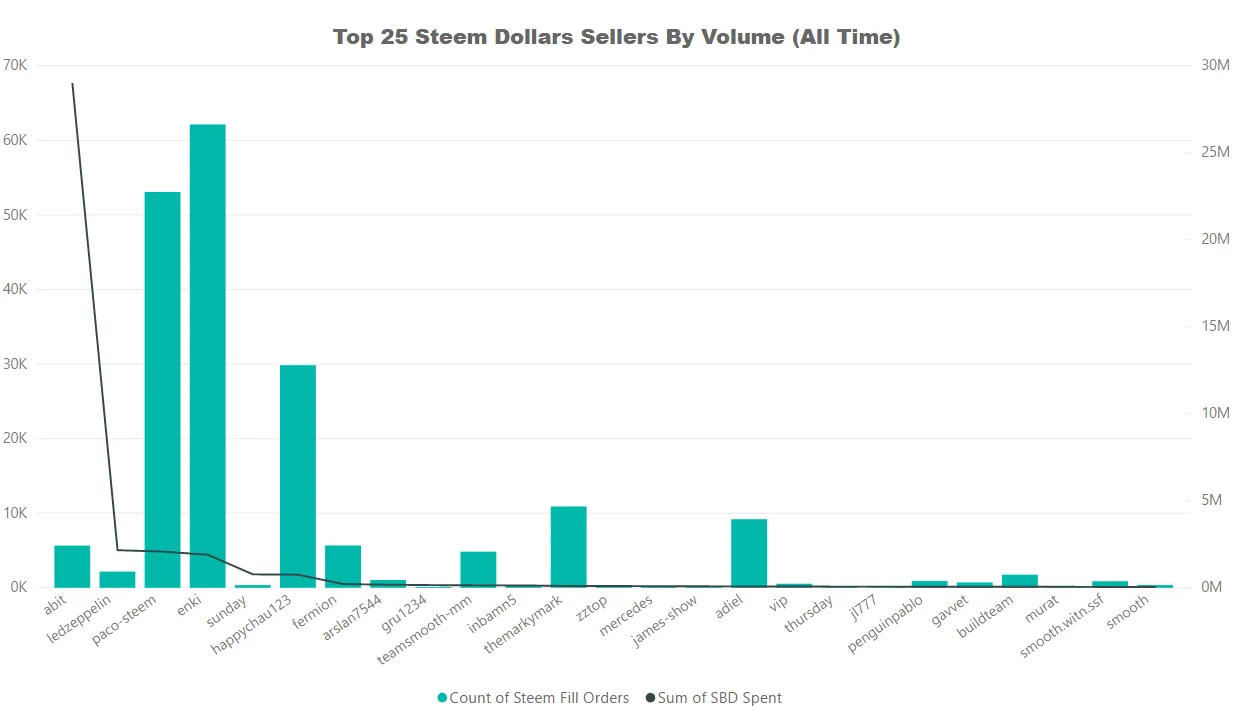
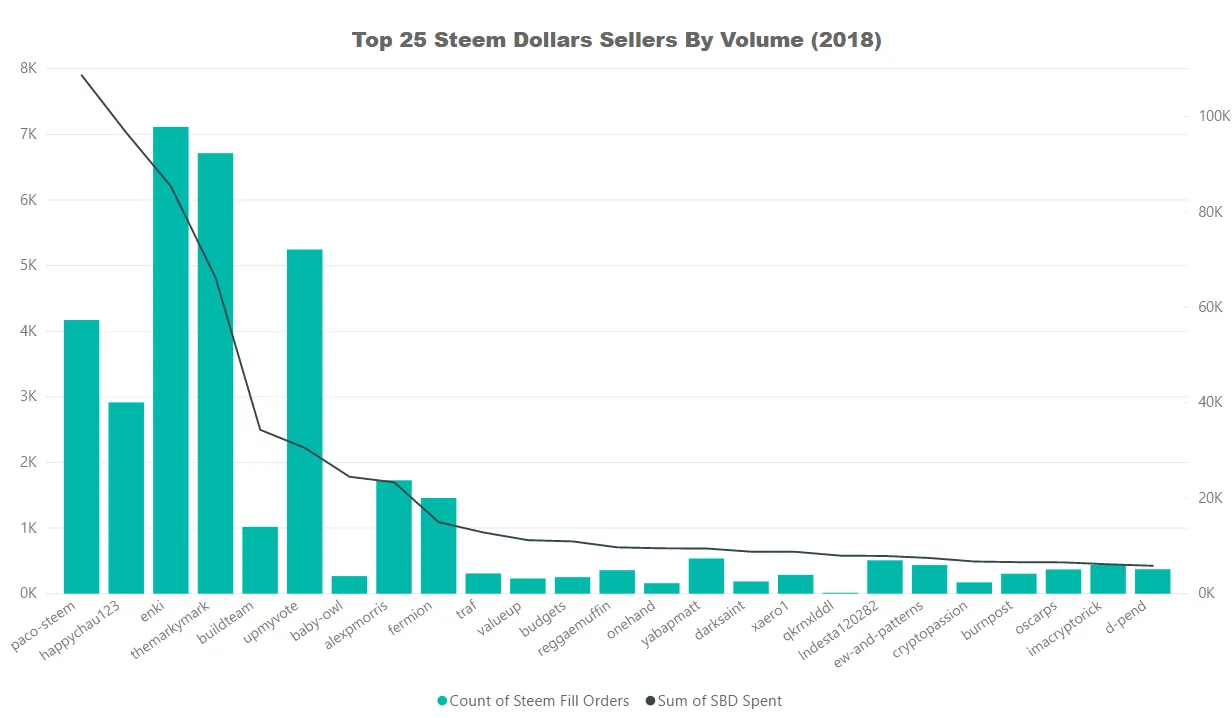
To capture the top liquidity providers in such a way that it will be readable in charts, the analyst limited it to only the top 25. To show how the top market participants are changing over time, the analyst is showing the top users in two charts; one with the data from the start of the Internal Currency Market till April 11, 2018, and another from the start of 2018 until the last available data (April 11, 2018).
Tools
The analyst used arcange's Steem SQL Database to obtain the data related to the internal market participants, count and volume of transaction, and the conversion rate using the VOFillOrders table. A variation of this query were used:
/*Data For Internal Currency Market*/
SELECT
    MONTH(VOFillOrders.timestamp) AS [MONTH],
    DAY(VOFillOrders.timestamp) AS [DAY],
    VOFillOrders.current_owner,
    VOFillOrders.current_pays,
    VOFillOrders.open_owner,
    VOFillOrders.open_pays
FROM
    VOFillOrders (NOLOCK)
WHERE
    YEAR(VOFillOrders.timestamp) = 2018 AND
    VOFillOrders.current_pays like '%STEEM%'
GROUP BY
    MONTH(VOFillOrders.timestamp),
    DAY(VOFillOrders.timestamp),
    VOFillOrders.current_owner,
    VOFillOrders.current_pays,
    VOFillOrders.open_owner,
    VOFillOrders.open_pays
The columns VOFillOrders.current_pays and VOFillOrders.open_pays returned values with STEEM and SBD in the end, the analyst removed those by using Microsoft Excel's LEFT and LEN function, then converted the results to numbers.
The external exchanges data was taken from the Historical Data feature of CoinMarketCap. The data sets were processed using Microsoft Excel pivot, and the charts were created using Microsoft Power BI.
Results
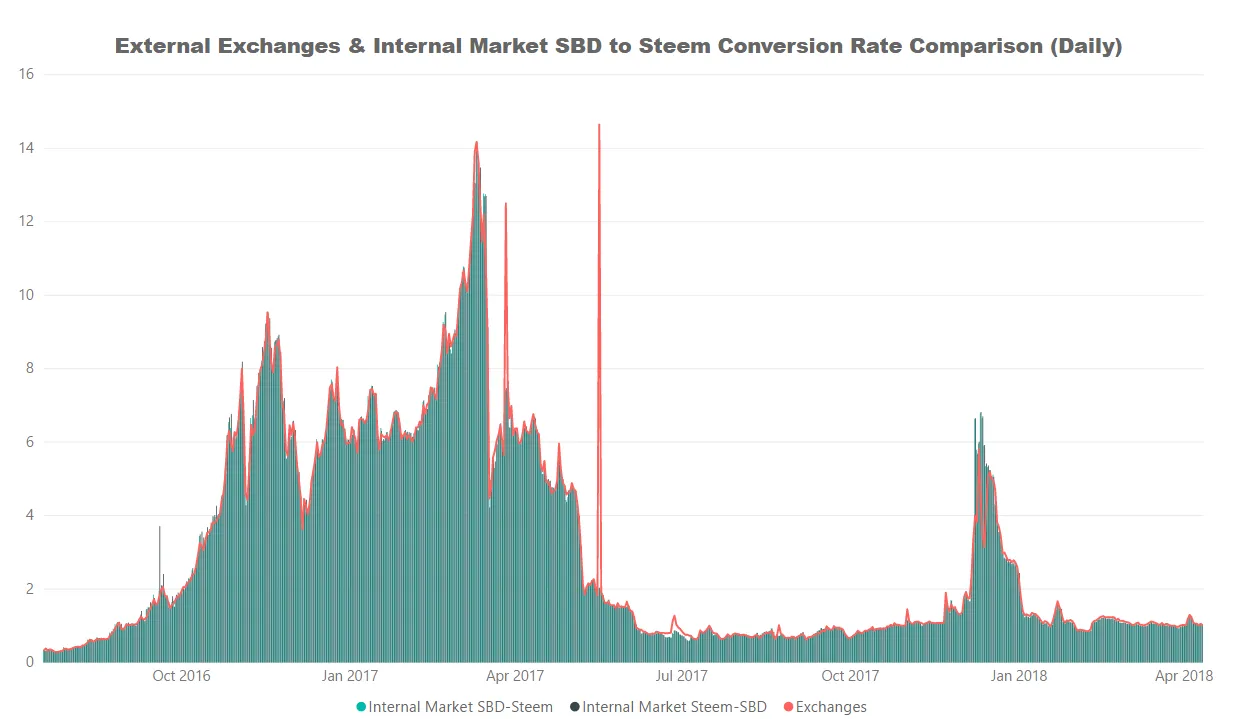
The analyst used two charts to show that the claims about the use of external exchanges being better in terms of conversion, at least when Steem Dollars is being converted to Steem to be a myth. The more granular daily chart above will show that the external exchanges' average conversion rate is almost mirrored exactly in the Internal Currency Market.
The analyst used the sum of Steem spent/SBD received per day for the black bar, Steem received/SBD spent for the green bar, and the mean of low and high from CoinMarketCap to put these two charts together. To get the monthly averages for the exchanges, the SUMPRODUCT function was used to consider the weight of volume.
In the daily chart, you would notice a couple of clear anomalies, one is a brief pump of Steem Dollars as shown in the table below towards the end of March 2017. The 17th of May 2017 is a clearer pump and dump when Steem Dollars pumped to as high as $22.34 from a high of $1.73 the previous day. The price then went back to $1.7 to $1.88 range the following day.
| Date | High | Low | Volume |
|---|---|---|---|
| 26/03/2017 | 1.06 | 0.959132 | 26446 |
| 27/03/2017 | 3.22 | 1 | 1809490 |
| 28/03/2017 | 1.5 | 0.95976 | 753459 |
| 29/03/2017 | 1.17 | 1 | 125978 |
| 30/03/2017 | 1.25 | 1.03 | 150026 |
| 31/03/2017 | 1.19 | 1.07 | 81741 |
| 01/04/2017 | 1.21 | 1.04 | 96816 |
| 02/04/2017 | 1.16 | 1.03 | 78490 |
| 03/04/2017 | 1.08 | 0.97597 | 27867 |
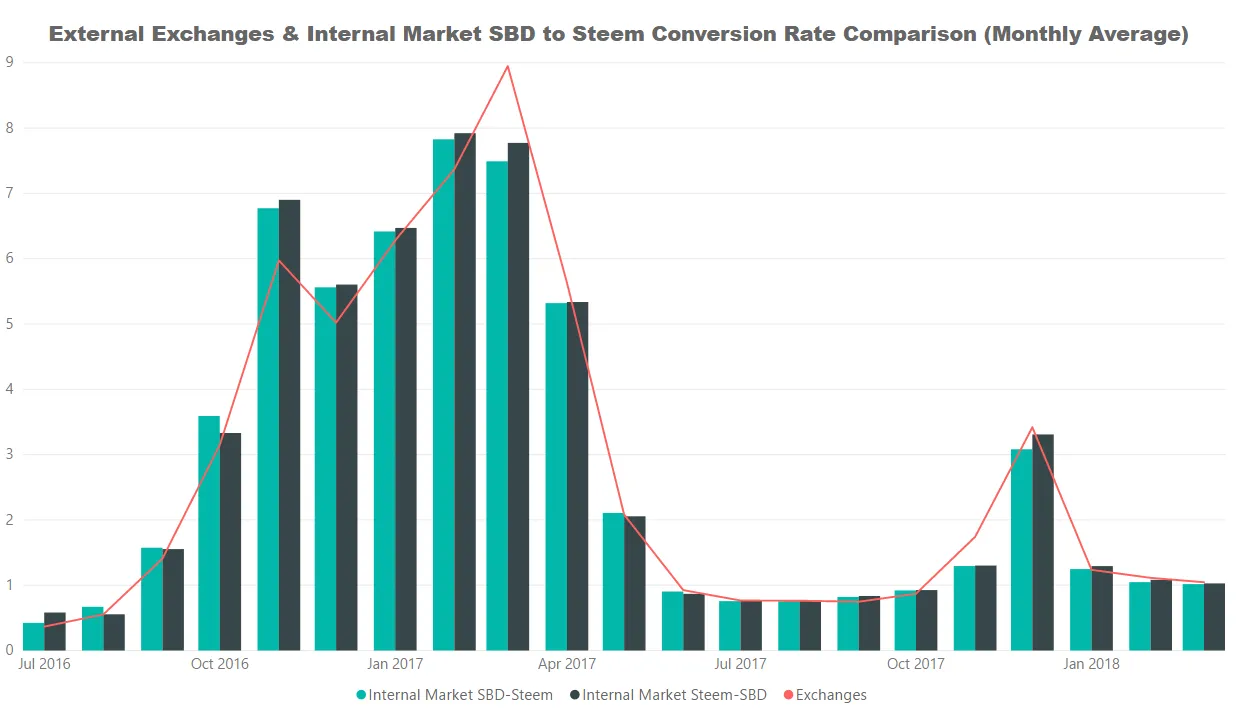
In this monthly average chart, some of the noise were removed, and it becomes clearer that the Internal Currency Market conversion is just the same, if not slightly better than the exchanges. The only months where the exchanges rates were better was in the months of March 2017 because of the momentary pump of Steem Dollars, and in November when a similar pump was observed as shown in the table below.
| Date | High | Low | Volume |
|---|---|---|---|
| 21/11/2017 | 1.01 | 0.927019 | 71780 |
| 22/11/2017 | 3.02 | 0.948523 | 23440900 |
| 23/11/2017 | 1.67 | 1.32 | 1565610 |
| 24/11/2017 | 1.38 | 1.21 | 622332 |
| 25/11/2017 | 1.96 | 1.27 | 5825160 |
| 26/11/2017 | 1.66 | 1.47 | 810629 |
| 27/11/2017 | 1.96 | 1.59 | 1572120 |
| 28/11/2017 | 1.76 | 1.53 | 842989 |
| 29/11/2017 | 1.58 | 1.22 | 607306 |
Orders vs. Prices & Conversion Rate
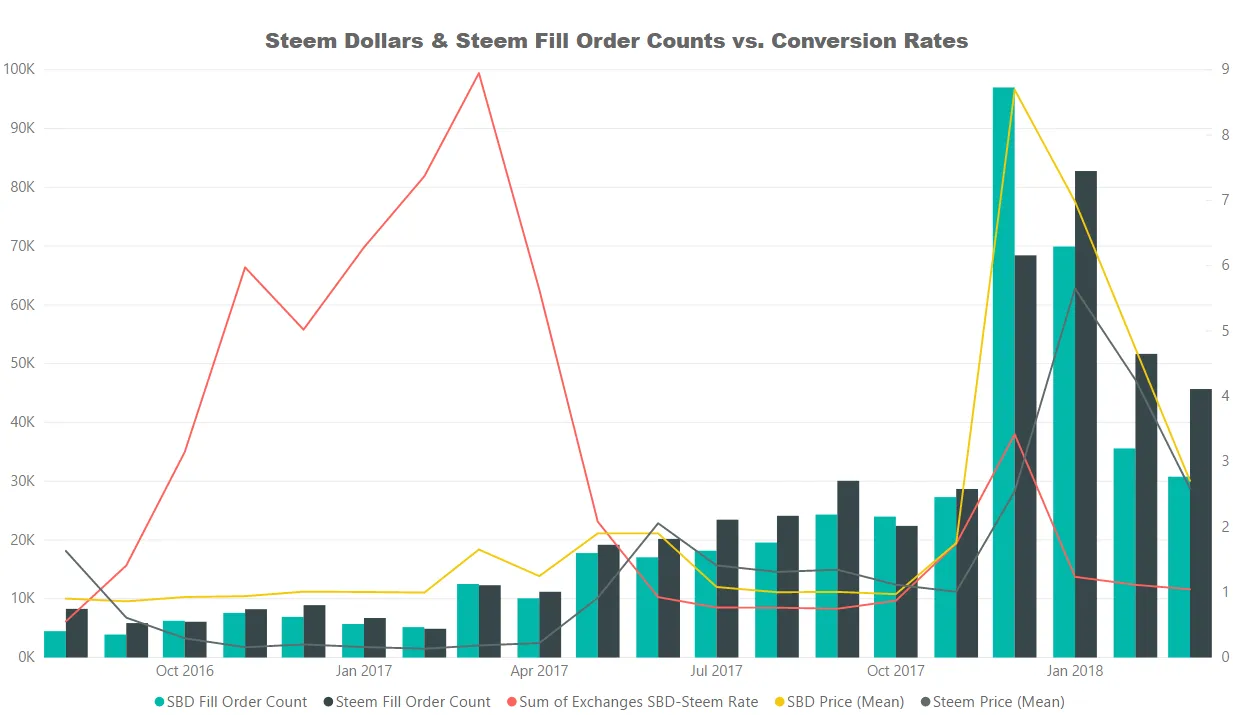
The count of orders for Steem is almost always more than the orders for Steem Dollars as shown in this chart. October 2017 and December 2017 were exceptions to this. For October 2017 orders, it seems almost like users (at least some users) knew Steem Dollars will start pumping in November 2017. The December orders for Steem Dollars being more than orders for Steem is likely in anticipation that Steem Dollars will pump even higher.
The trend of more orders for Steem than Steem Dollars went back in January 2018. As shown in the chart, it was significantly higher compared July-September 2017. It looks like users have some expectancy the Steem Dollars will continue to correct, and Steem will be valued more (like what we have seen today).
Top Accounts Providing Liquidity for The Internal Currency Market
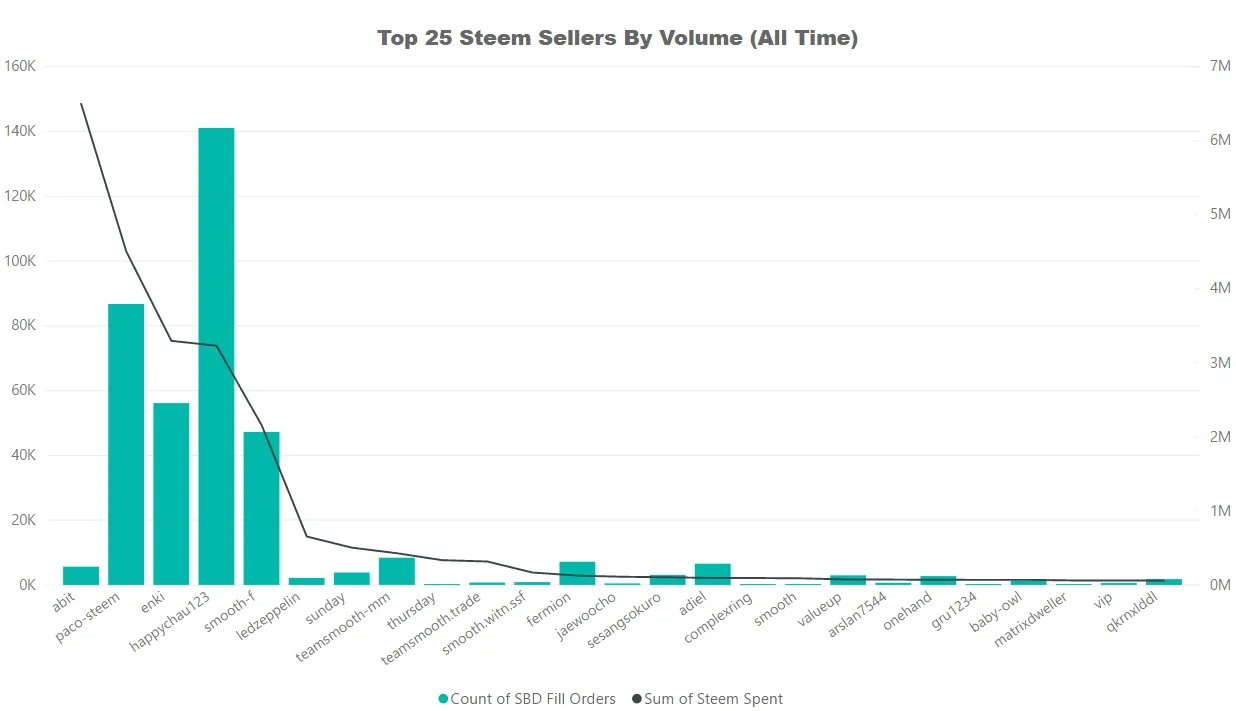
abit still has the record of higher volume of orders in the internal market both for Steem and Steem Dollars. The linked contribution from paulag earlier in this analysis explains why. This is the reason why I used another chart delimited to show only 2018 data; to show if there's been a change in behavior after the incentive of liquidity rewards was removed.
In both the charts delimited to 2018 data, abit is nowhere to be found. It looks like happychau123, paco-steem, enki and a few smooth accounts continued to provide liquidity even post the sunset of liquidity rewards. The top Steem buyers for 2018 includes pay-for-upvote bots and operators. You would see themarkymark, buildteam, upmyvote, reggaemuffin, and xaero1 at the 2018 top 25 Steem buyers (Steem Dollar sellers).
Conclusion
The remarks about exchange rate being more often better in external exchanges is a myth as the data-points suggest in this analysis. There is arbitrage opportunities across exchanges yes, and taken individually with timing, the rate can be better in a specific exchange. The point however is that users must not avoid the Internal Currency Market just because people say exchanges are more often offering better rates. With the exchange rate being the same, there is still the benefit of not having to pay transaction fees when using the internal market.
Posted on Utopian.io - Rewarding Open Source Contributors